Adding Real User Monitoring (RUM) to your ITSI environment
Your organization is looking for better ways to understand the total picture when it comes to your web properties, apps, and cloud footprint. Different areas of your organization have different requirements for insights and information relating to these areas, for example:
- IT Operations needs to quickly determine if an outage or incident is related to a given mobile app, app version, or browser.
- CIOs / CTOs need to get an accelerated understanding of the health of cloud infrastructure, and get quick stats on mobile and web properties.
- Business leaders need immediate insights into the impact of software, infrastructure, and app changes.
- DevSecOps needs to fully understand the data that molds their decisions, and be able to assess current issues impacting the software delivery process and changes impacting users in the real world. This data can be crucial in telling user stories that drive performance improvements and feature updates within the organization.
Solution
The Content Pack for Splunk Observability Cloud can help you meet these needs through Splunk Real User Monitoring and Splunk Real User Monitoring for Mobile, included within the Content Pack. With Splunk Real User Monitoring, your organization can start using Real User data with other data sources already in your Splunk ITSI environment.
The content pack includes everything from high level Executive Glass Tables for quick summaries, to quick navigation out of ITSI into Splunk Observability Cloud for further investigation of real time RUM, APM, and infrastructure metrics. If your organization is moving to Splunk Observability Cloud, modernizing IT Operations, or moving from monoliths to microservices, this content pack is ideal for you.
The RUM functionality within the content pack provides:
- 3 RUM dashboards
- 2 new glass tables
- 4 updated glass tables
- Additional service analyzer sections for RUM
- 3 services for RUM, RUM Mobile, and RUM Synthetics
- 12 RUM-specific KPIs (including easy-to-change thresholds)
These features, combined with additional navigation suggestions for quickly moving from Splunk ITSI to Splunk Observability Cloud, provide useful views for IT Operations, Business & IT Executives, DevOps, and Software Engineers. For Splunk or ITSI experts, these services/service templates, KPIs, KPI base searches, and entities can be leveraged as templates for enriching the business logic that already exists in Splunk and ITSI with Splunk Observability metrics.
If you are a customer using IT Essentials Work, some of the features in the Content Pack for Splunk Observability Cloud will be more limited than the features available for customers using Splunk ITSI.
Installing and configuring the Content Pack for Splunk Observability Cloud
The Content Pack for Splunk Observability Cloud is bundled within the Splunk App for Content Packs v1.6.0 and up.
Glass tables
The Content Pack for Splunk Observability Cloud includes four preconfigured glass tables providing Real User insights:
- Executive Glass Table
- RUM Overview Glass Table
- NOC Glass Table
- Devops / SRE Detailed View Glass Table
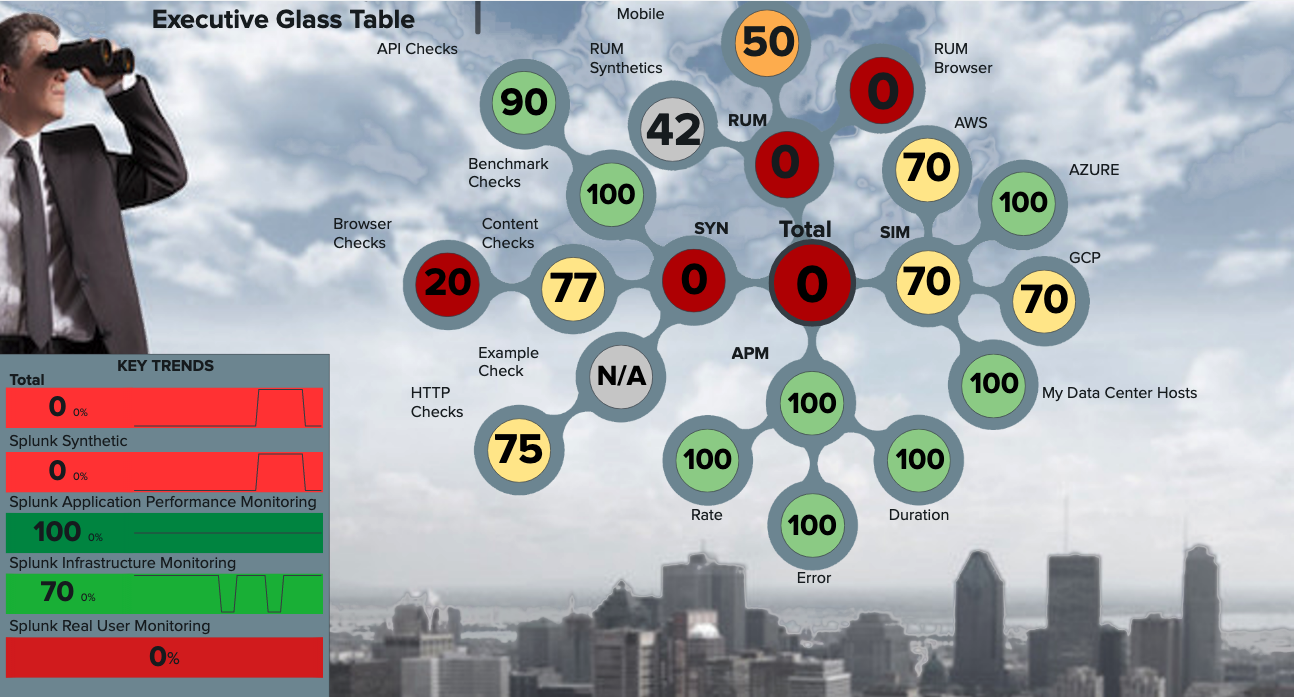
Executive Glass Table
The Executive Glass Table delivers rolled-up insights across 4 major observability areas: Synthetic Monitoring, Infrastructure Monitoring, Splunk Real User Monitoring, and Application Performance Monitoring. In a single view, you get a quick and real-time update across your landscape and single-click access to additional details. This answers the questions of what is going on and why it’s happening, as well as provides a contextual deep-link to the source system in Splunk Observability Cloud. This information can dramatically improve MTTI, MTTD and MTTR by simplifying the process of finding and resolving the root cause of an issue.
The Executive Glass Table provides insights from Real User Monitoring data streaming out of Splunk Observability Cloud. This includes KPI Threshold values for visualizing the health of Real User experiences at a glance. Along with infrastructure metrics, synthetics testing, and APM tracing data, this glass table provides a high-level view of cloud and web property health.
RUM Overview Glass Table
The RUM Overview Glass Table brings your entire Splunk Real User Monitoring landscape together in one window.
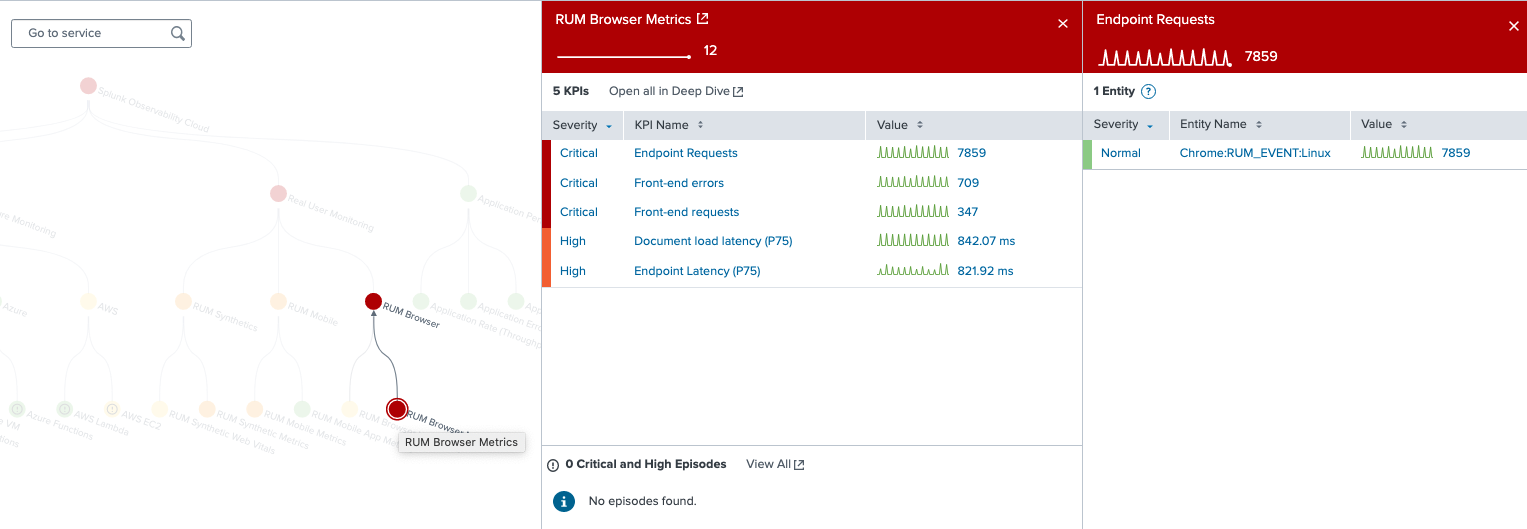
In the example glass table below, on the right, you can see the overall health of Real User sessions in apps, native browsers, and even synthetic user tests. To the left of this overview are more detailed breakdowns of KPIs specific to browsers, apps, and synthetic tests. Each KPI is colored in relation to incoming metrics and easily adjustable thresholds. You can click deeper into specific KPIs, and Splunk ITSI will help you navigate through your ITSI entities and onward into the RUM dashboards on Splunk Observability Cloud.

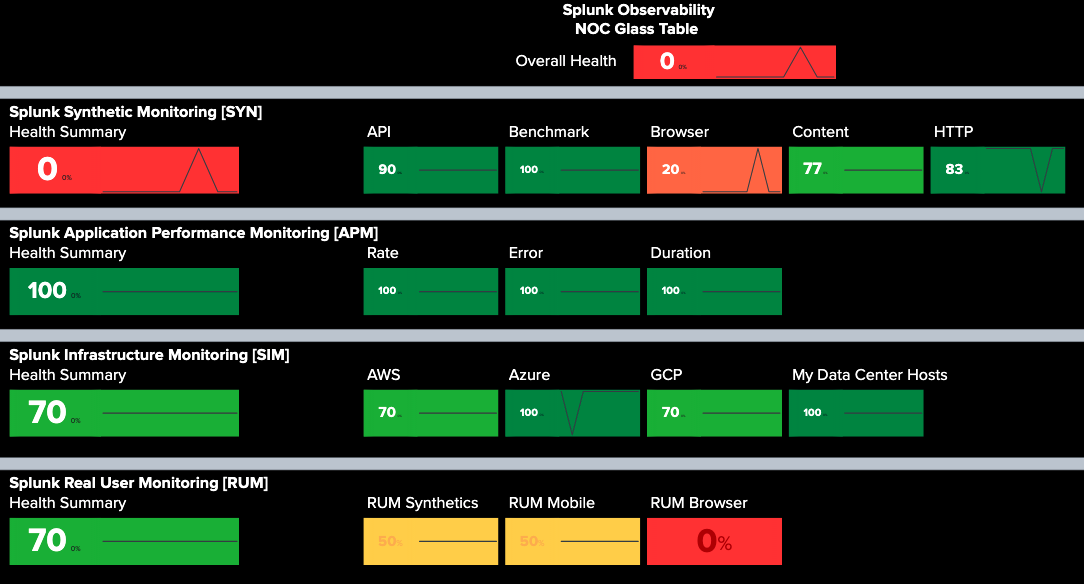
NOC Glass Table
In the NOC, signals and metrics must be sorted out quickly and information passed on to the correct teams to fix an issue. Speed is of the essence, and the possibilities for where to start troubleshooting can feel endless.
To help NOCs in this situation, this glass table includes RUM metrics. These additional signals can help more quickly diagnose wider issues. For example, a change that is deployed and begins to impact native browsers, but not apps, will become readily apparent from the change in browser KPIs. Drilling down into which KPIs are having issues can then further determine its cause. This enables IT Operations in the NOC to more quickly notify the correct teams, who can then rapidly get a fix into production.
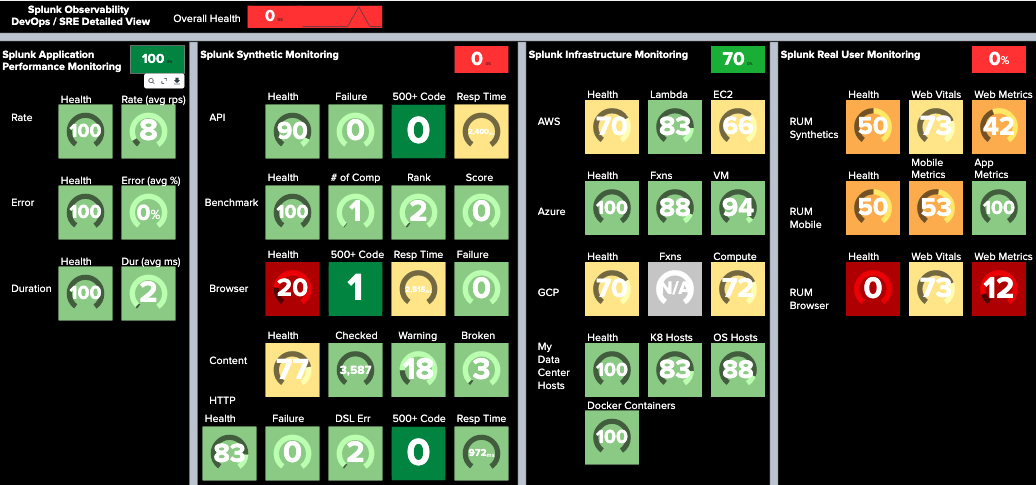
DevOps SRE Detailed View Glass Table
The glass table for DevOps and SRE functions includes RUM KPIs. RUM details can help tell the data stories that DevOps and SREs need to prioritize bug fixes, identify what to monitor, and help determine if newly deployed code changes are impacting the overall customer experience.
Additionally, using the clickthrough links to the underlying data will help them establish why an issue happened and what can be done in the future to avoid a similar incident.
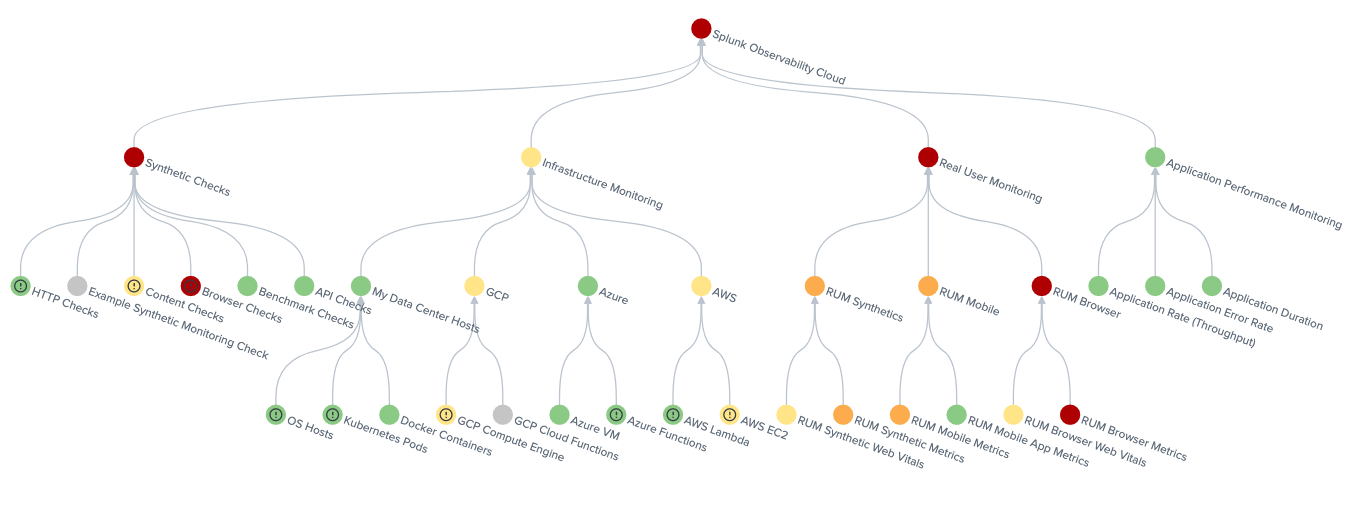
Service Analyzer
The Service Analyzer in the Content Pack for Splunk Observability acts as a map to discovering your entire cloud architecture and view KPIs specific to a Service. The Service Analyzer includes detailed RUM services, KPIs, and entities to help you navigate from the high-level view, through entity level KPIs, and even directs you onto detailed data within the Splunk Observability Cloud UI. KPIs are split up by Browser, App, and Synthetic tests.
KPIs
Key Performance Indicators (KPIs) for Splunk Real User Monitoring in Splunk ITSI pull from Splunk Observability Cloud RUM metrics to power the ITSI Service Analyzer (along with the ITE Work Infrastructure Overview) and enrich your ITSI entities. To complement these KPIs, easily modifiable thresholds have been included to help track the health of your organization’s RUM entities.
Additionally, KPIs for Google Web Vitals scores will help you understand how Google users and Google rankings are influenced by interactions with web properties.
The Content Pack for Splunk Observability Cloud provides over 80+ KPIs, and each of these KPIs link you through ITSI entities to specific dashboards and onward through navigation suggestions within the Splunk Observability Cloud UI.
Additional resources
These additional Splunk resources might help you understand and implement these recommendations:
- Product Tip: Moving to observability with ITSI
- Splunk Docs: Overview of the glass table editor in Splunk ITSI
- Splunk Docs: Installing and configuring the Content Pack for Splunk Observability Cloud