Summarizing high-cardinality metrics by using metrics pipeline management
You are a site reliability engineer (SRE) for your organization in charge of monitoring observability ingest usage for your team. You need to make sure you stay within your company’s budget.
You notice your team's metrics usage has recently increased. You obtain a detailed metrics usage report that gives you insights into the metrics volume, high cardinality dimensions, usage of the metrics in charts and detectors, and distribution of metrics.
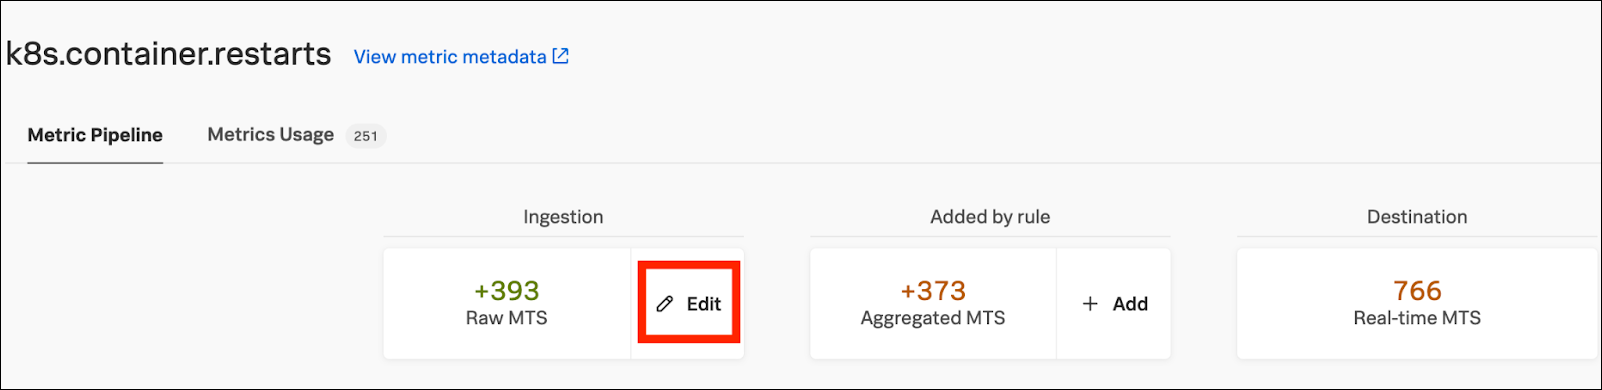
The metrics usage report shows your team sends 393 metric time series (MTS) for the k8s.container.restarts metric to Splunk Observability Cloud. You know based on discussions with your team that not all the data is necessary at full granularity. To understand more about the cardinality of different dimensions, you review the report and notice that the container.id dimension is the highest cardinality dimension for k8s.container.restarts.
You know your team cares most about Kubernetes (k8s) container names when it comes to k8s restarts, so they only need to monitor the k8s.container.names dimension. The container.id dimension is not information they need to monitor.
You need to discard the container.id from the data being sent to Splunk Observability Cloud.
Solution
In Splunk Observability Cloud, you can use metrics pipeline management to create an aggregation rule that reduces the cardinality of k8s.container.restarts by keeping the k8s.container.names dimension and discarding container.id.
- In the left navigation pane, click Metrics Pipeline Management, then Choose metric.

- Search for the
k8s.container.restartsmetric and click Choose.
- On the Aggregated MTS tile click + Add.
- Under Active dimension names, select container.id.

- In Select dimensions, choose Drop from the dropdown.
- In the Generate a new metric name field, enter
k8s.container.restarts_nameand click Generate Name. - Next, download the list of charts and detectors that use the
k8s.container.restartsmetric. Click Metrics usage and then click Download.
- For each chart and detector identified in the list, replace
k8s.container.restartswithk8s.container.restarts_nameby editing the associated chart and detector in Splunk Observability Cloud. You now have a new aggregatedk8s.container.restarts_namemetric that yields an acceptable MTS level. - You can now choose to drop or archive the unaggregated raw metric that the team no longer needs to monitor.
- To drop the metric, click Edit on the Raw MTS tile, then in the pop-up window select Dropped and click Update.

- To archive the metric, follow the steps above but click Archived instead of Dropped. Archived metrics are not available in charts and detectors. You can change routing to real time or filter a subset of data to real time to make those metrics available in charts and detectors again. You can also restore archived data from up to 8 days ago in case you need it.

- To drop the metric, click Edit on the Raw MTS tile, then in the pop-up window select Dropped and click Update.
- Verify the new metric volume after dropping or archiving the data you don’t need, and save the rules.
By combining aggregation and data dropping rules, you have successfully summarized a high cardinality metric, creating a more focused monitoring experience for your team while minimizing storage costs for the company.
Next steps
These resources might help you understand and implement this guidance:
- Product tip: Using high-cardinality metrics in monitoring systems