Prescriptive Adoption Motion - Event Analytics
Due to the rapid increase in data from IT and business systems in recent years, ITOps teams face challenges in making sense of this vast amount of information. They deal with data from numerous critical services, infrastructure, packaged applications (such as SAP, Microsoft, Oracle, and Salesforce), and third-party domain managers. Handling such a large volume of data makes it impossible for humans to efficiently group and prioritize the information, leading to frustration, delays in incident resolution, and higher costs for IT Operations Centers.
For more than two decades, ITOps teams have been using monitoring tools and incident management tools. However, the combination of these tools and siloed teams results in an overwhelming number of alerts, many of which are duplicates, making it difficult to comprehend both ITOps and business data. This situation leads to unplanned downtime, reactive responses, and staff burnout, all of which hinder the ITOps' ability to support and expand the business.
To address these issues, some ITOps teams have started using AIOps, which involves applying artificial intelligence (AI) and machine learning (ML) to operations. AIOps can help reduce alert noise and tackle the challenges caused by traditional approaches. Some teams have implemented separate AIOps middleware tools like BigPanda or Moogsoft to focus on event correlation and noise reduction. However, these tools are often complex to set up, contribute to tool sprawl, increase overall costs, and might not effectively prioritize alerts based on their impact on business services.
Aim and strategy
ITOps teams face the challenge of dealing with a large amount of data to identify and resolve issues swiftly. One effective approach is to reduce alert noise by grouping related alerts, enabling teams to understand their environment more rapidly. Additionally, prioritizing these grouped alerts helps ITOps teams focus on critical matters. Intelligent event correlation, powered by machine learning, further enhances this process by grouping and prioritizing logs, metrics, and events from various sources like infrastructure, applications, and networks. This can reduce alert noise by over 90%. By pinpointing a few actionable events and prioritizing them based on their impact on services, ITOps teams can quickly identify the root cause of an issue and improve their mean time to resolve critical incidents (MTTR).
Splunk customers who have deployed event analytics in Splunk ITSI have realized several benefits, including quick data ingestion from various sources through existing integrations. Splunk ITSI consolidates monitoring, event, and incident management tools in a centralized platform, allowing teams to view all alerts in one place without switching between tools or replacing existing investments. Integration with IT service management and orchestration tools further streamlines incident monitoring, detection, response, and resolution from a single location.
With the aid of machine learning and rules-based correlation, Splunk ITSI significantly reduces event noise, making it easier to identify probable root causes. This grouping and prioritization of alerts empower teams to involve the right stakeholders and swiftly address incidents.
Common use cases
- Event analytics - Alert noise reduction, event management, event clustering, alert correlation and intelligent event management
- Business service insights - Service monitoring and insights
- Advanced analytics and alerting - Predictive analytics
User roles
| Role | Responsibilities |
|---|---|
|
ITOps Leader |
Manage teams that build and deliver software and services |
|
ITOps Practitioner |
Manage hybrid environment and services, and resolve incidents |
|
Engineering Team |
Provide self-service tooling for developers to improve productivity and create consistency across teams |
|
Developer |
Design, build, deploy, and debug application code |
|
IT Operations/NOC Analyst |
Use Episode Review to investigate and troubleshoot issues |
|
ITSI Admin |
Onboard data, deploy relevant content packs, create correlation searches, configure Notable Event Aggregation Policies, and configure integrations with external ITSM tools (SNOW, Remedy, Splunk On-Call, etc) to meet business requirements |
Preparation
1. Prerequisites
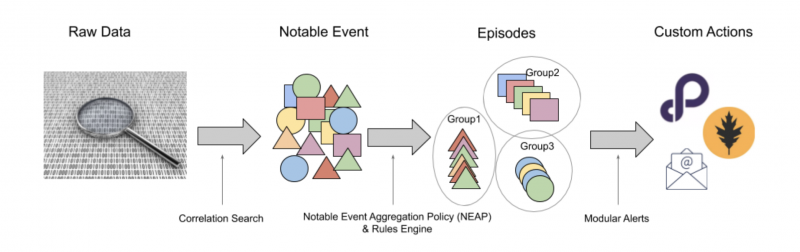
Splunk ITSI event analytics is designed to make event storms manageable and actionable. After data is ingested into ITSI from multiple data sources, it's processed through correlation searches to create notable events. ITSI generates notable events when a correlation search or multi-KPI alert meets specific conditions that you define. Notable event aggregation policies group the events into meaningful episodes, a group of events occurring as part of a larger sequence (an incident or period considered in isolation). Use episode review to view episode details and identify issues that might impact the performance and availability of your IT services. You can then take actions on the episodes, such as running a script, pinging a host, or creating tickets in external systems.
2. Recommended training
ITSI users
- What is Splunk? - free eLearning
- Intro to Splunk - free eLearning
- Using fields - free eLearning
- Visualizations - free eLearning
- Using Splunk IT Service Intelligence - 4.5 hour instructor-led training
ITSI admins
- Getting Data In - free eLearning
- Working with time - free eLearning
- Correlation analysis - 3 hour instructor-led training
- Intro to knowledge objects - free eLearning
- Creating knowledge objects - free eLearning
- Data models - free eLearning
- Creating field extractions - free eLearning
Splunk Enterprise administrators:
- Splunk Enterprise system administration - 12 hour instructor-led training
- Splunk Enterprise data administration - 18 hour instructor-led training
Splunk Cloud Platform administrators:
- Splunk Cloud Platform administration - 18 hour instructor-led training
- Implementing Splunk IT Service Intelligence - 18 hour instructor-led training
3. Resources
- Professional Services
- A Splunk IT Operations analytics discovery workshop is a comprehensive requirements-gathering activity that defines the services and associated Key Performance Indicators (KPIs) that you wish to manage and monitor in your environment.
- A Splunk IT Ops review and roadmap workshop evaluates and prioritizes your IT operational objectives aligned to support your business goals. Our analysis results in the development of a use-case-oriented roadmap that provides guidance, risk mitigation, and milestones to adopt Splunk Enterprise and Splunk ITSI.
- A Splunk Professional Services optimization check provides a comprehensive review of your Splunk environment to ensure your deployment remains sustainable, stable, and ready to scale.
- On-Demand Services (ODS)
- Assigned Expert (AE)
Self-service resources
- Get familiar with your Support Portal
- Sign up for Community Office Hours
- Find answers and support on Splunk Community and join the Community Slack
- Sign up for Tech Talks and Newsletters
4. Considerations
Splunk ITSI is a premium application installed on Splunk Enterprise or Splunk Cloud Platform. Splunk ITSI can be configured to be a "monitor of monitors" for other monitoring tools or a "manager of managers" for events depending on requirements. See Best practices for implementing event analytics in ITSI before you begin setting up and configuring Splunk ITSI.
Universal alerting is part of the Content Pack for Monitoring and Alerting and provides a reusable way to ingest third party alerts into Splunk ITSI, without the need to create correlation searches or notable event aggregation policies. Learn about the Content Pack for Monitoring and Alerting with these resources:
- Blog: Managing IT just got easier: Introducing the new Splunk App for Content Packs
- Tech Talk: Finding signal in the noise quickly with the Splunk Content Pack for ITSI Monitoring and Alerting IT Edition
- Tech Talk: Getting started with AIOps: event correlation basics and alert storm detection in Splunk IT Service Intelligence
Implementation guide
- Ingest events through correlation searches.
- Configure aggregation policies to group events into episodes.
- Setup up automated actions to take on episodes. For example, configuring episode ticketing integrations.
- Test, validate, and optimize.
For full procedures and best practices to help you implement event analytics in Splunk ITSI, use the following resources:
- Working with event analytics in ITSI
- The Events analytics manual provides in depth documentation on how to set up and configure Splunk ITSI.
- Best practices for implementing event analytics in ITSI
- Troubleshoot the rules engine and event grouping in ITSI
- Best practices for improving IT operations posture
Success measurement
When implementing the guidance in this adoption guide, you should see improvements in the following:
- Prioritizing actionable events so ITOps teams can quickly find root cause and resolve critical incidents
- Mean time to detect or repair (MTTD/MTTR)
- Reduction in alert noise by more than 90%
- Improved event management
- Alert and episode storm detection
- Improved IT Operations posture