Monitoring AWS Elastic Compute Cloud using Splunk Infrastructure Monitoring
You've got your AWS Cloud data into Splunk Observability Cloud, and now you’re looking to answer some questions about EC2 instances hosting critical workloads. Using Splunk Infrastructure Monitoring, you might want to identify EC2 instances that:
- Have consistently low CPU utilization (over-provisioned) that might be contributing to excessive or wasted cloud spend
- Appear to be overutilized (under-provisioned) and might be impacting the performance of the workloads being hosted
- Have CPU utilization running high so you can determine if that is normal behavior based upon historical performance
- Experience disk read or write operations that are not normal for the host, or in other words, that deviate from the historical baseline average
This article is part of the Splunk Use Case Explorer for Observability, which is designed to help you identify and implement prescriptive use cases that drive incremental business value. In the Use Case Explorer, this article is part of Infrastructure monitoring.
How to use Splunk software for this use case
- ► CPU utilization running low (over-provisioned)
-
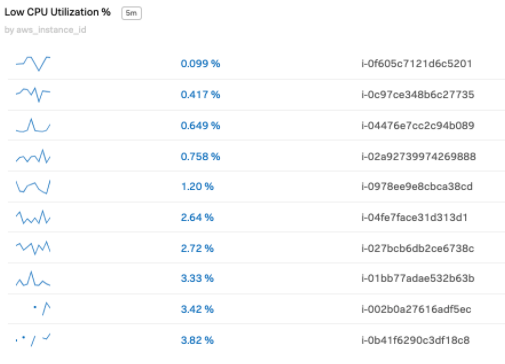
The CPU utilization % metric is the total number of CPU units used, expressed as a percentage of the total available. EC2 instances with consistently low CPU utilization might indicate over-provisioning, and might contribute to excessive or wasted cloud spend.
You can customize dashboards to identify these instances so they can be addressed. The example below shows a list chart which can be incorporated into a dashboard that lists the EC2 instances running low CPU utilization %.
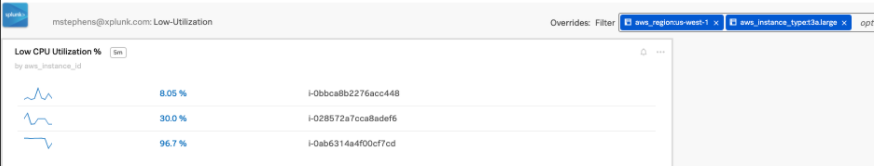
You can also add dashboard filters to narrow the list to focus on. The example below shows filtering to a specific AWS region and a specific AWS EC2 instance type that might represent high dollar price points.
- ► CPU utilization running high
-
In some instances, it can be challenging to create high-value alerts in high CPU utilization situations - for example, when an EC2 instance is designed to run at high CPU utilization. In an example like this, an EC2 instance used for batch processing workloads between 1-3 AM daily results in the workloads maxing out the CPUs. Classic static alerting thresholds fall short in this scenario, resulting in low alert quality and too much "alert noise".
You can start to create more useful alerts, using data analytics to determine what is historically normal or not normal, by using detectors in Splunk Infrastructure Monitoring.
In this scenario, the cloud infrastructure team wants to be notified when the CPU utilization varies substantially from normal. The cpuUtil% metric varies depending on the time of day, so the alert design has to look at historical metrics to compare streaming real-time metrics to determine if it was normal for the same time period historically.
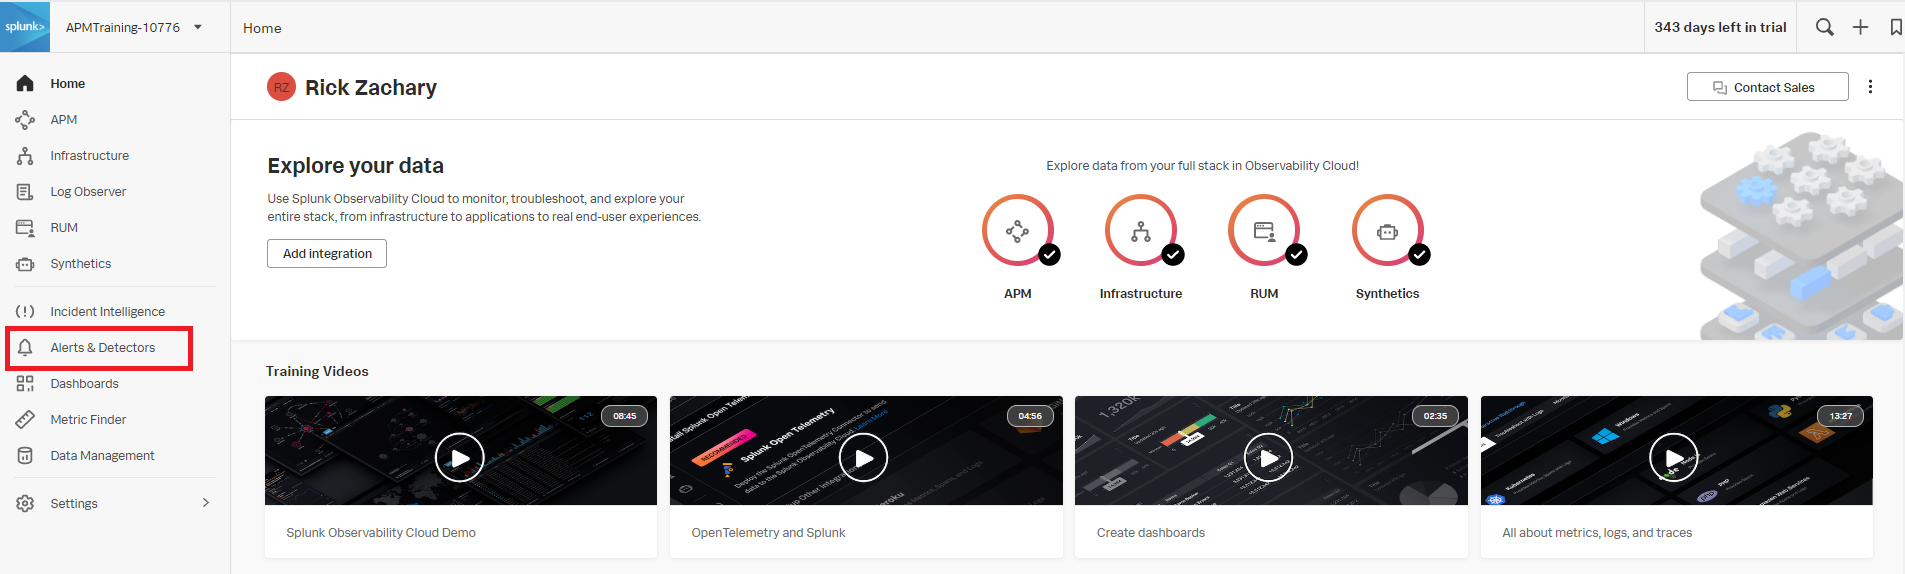
- In Splunk Observability Cloud, click Alerts & Detectors in the left navigation pane.
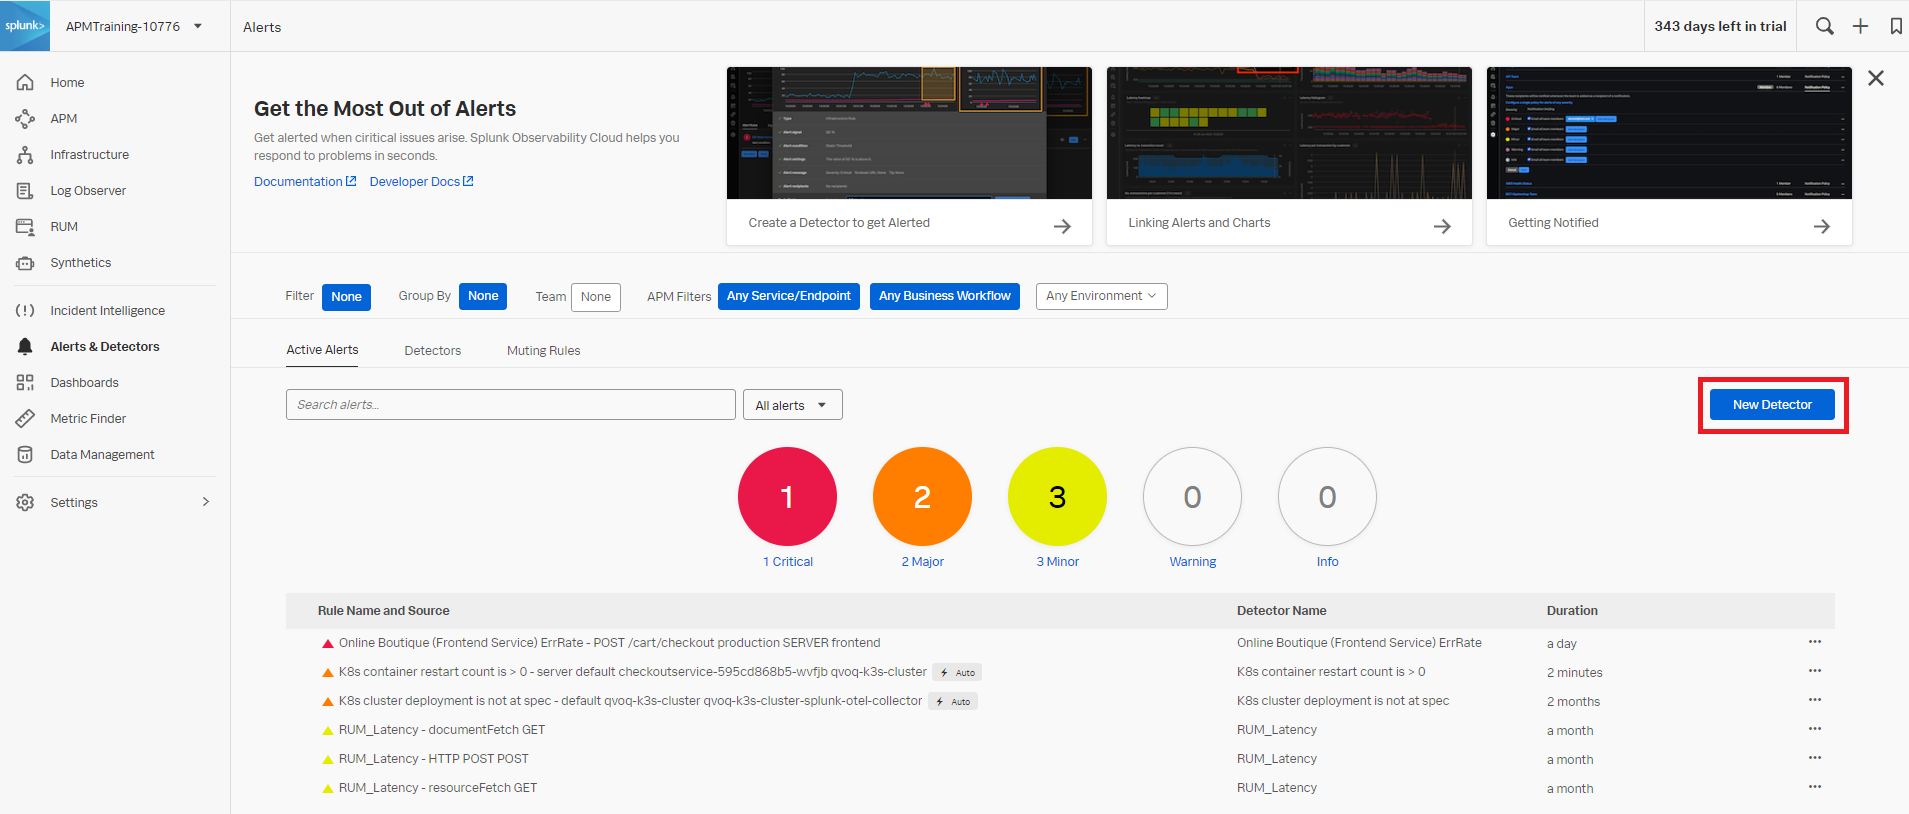
- Click New Detector.
- Enter the detector name and click Create Alert Rule.
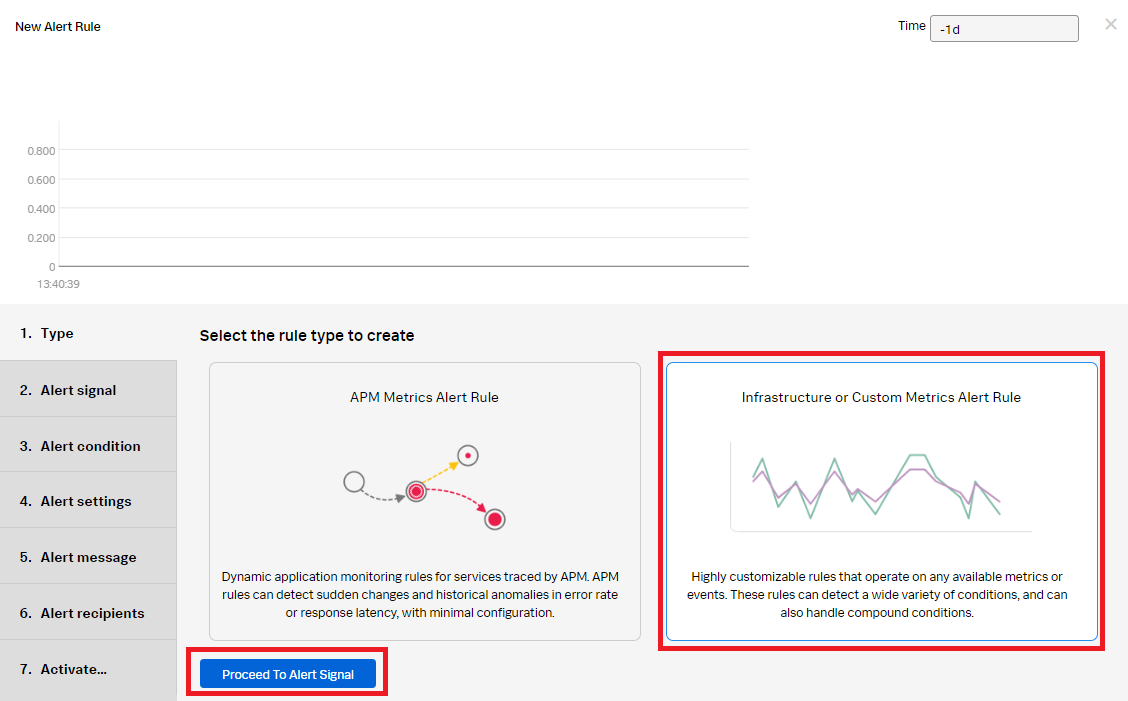
- Click Infrastructure or Custom Metrics Alert Rule, then click Proceed To Alert Signal.
- In the Alert signal section, do the following:
- Add the aws.ec2.cpu.utilization signal.
- For Plot B, click Enter Formula and name it "A" to reference Plot A.
- Click Add Analytics and select Mean from the dropdown. Select Moving Window and set it to 30 minutes.
- Click Proceed To Alert Condition.
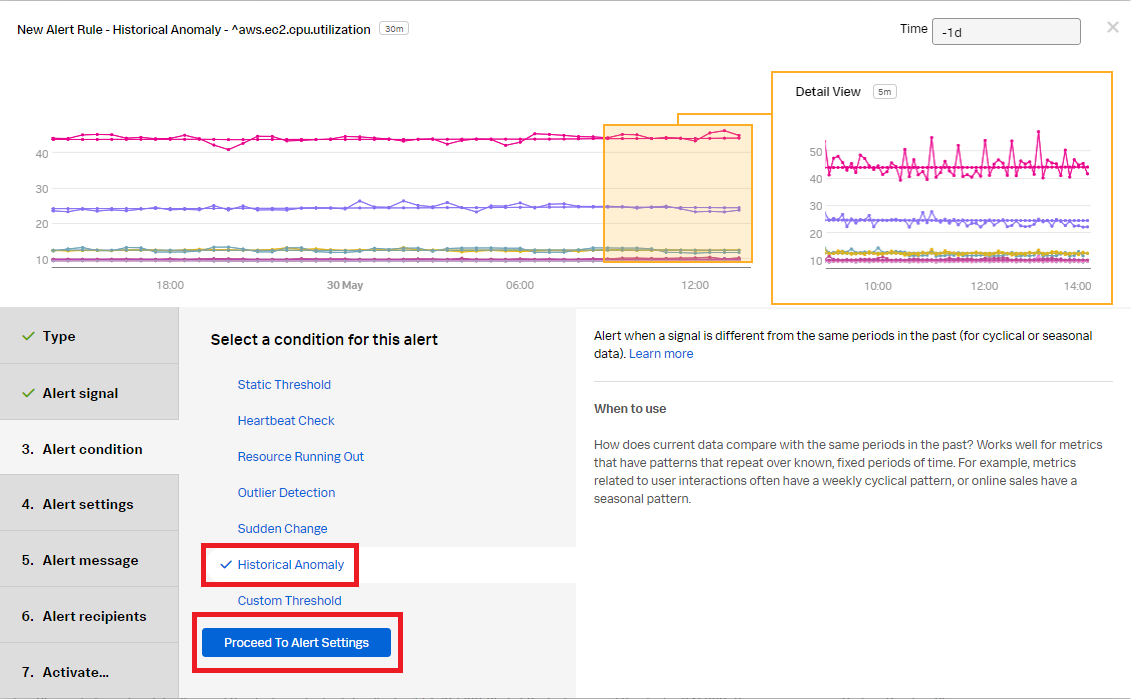
- Select Historical Anomaly to alert when the signal is different from the same period in the past. Click Proceed To Alert Settings.

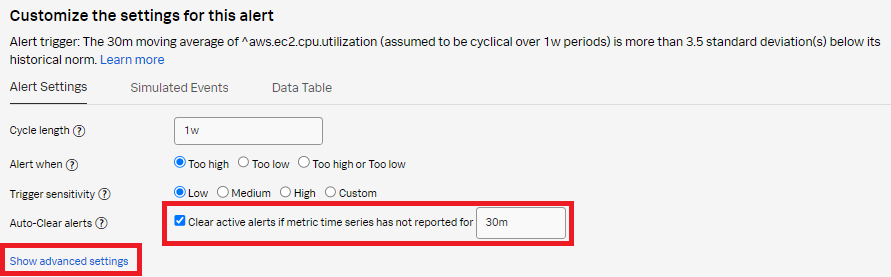
- Select Clear active alerts if metric time series has not reported for and set it to 30m, then click Show advanced settings.
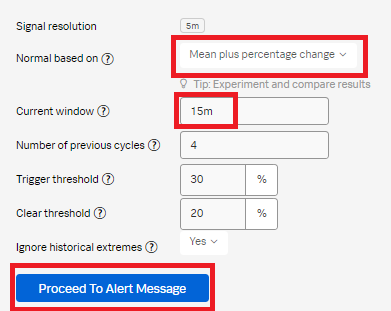
- Set Normal based on to Mean plus percentage change. Change the Current window to 15m. Click Proceed To Alert Message.
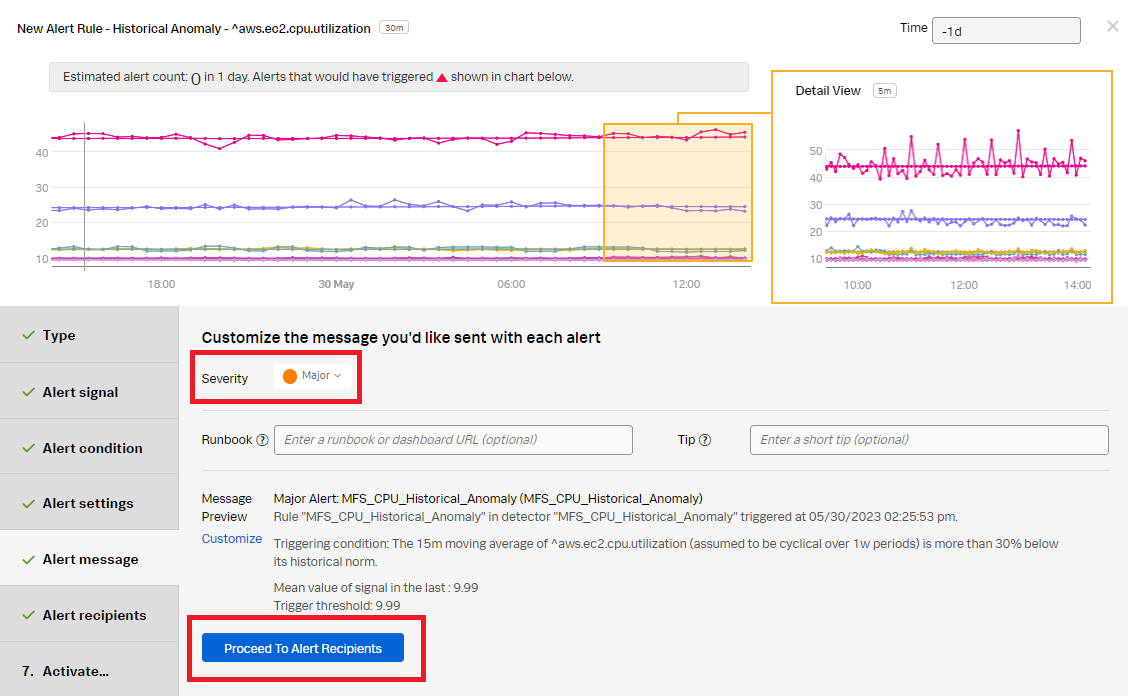
- In the Alert message section:
- Set the alert severity. You can choose from Critical, Major, Minor, Warning, or Info depending on the alert severity defined by your organization.
- Optionally, enter a runbook or dashboard URL and a short tip for end user troubleshooting the alert.
- Customize the alert message by clicking Customize.
- Click Proceed to Alert Recipients.
- In the Alert recipients section, select the recipients to send the alert message to. You can choose an email address, team, or webhook. Click Proceed to Alert Activation.

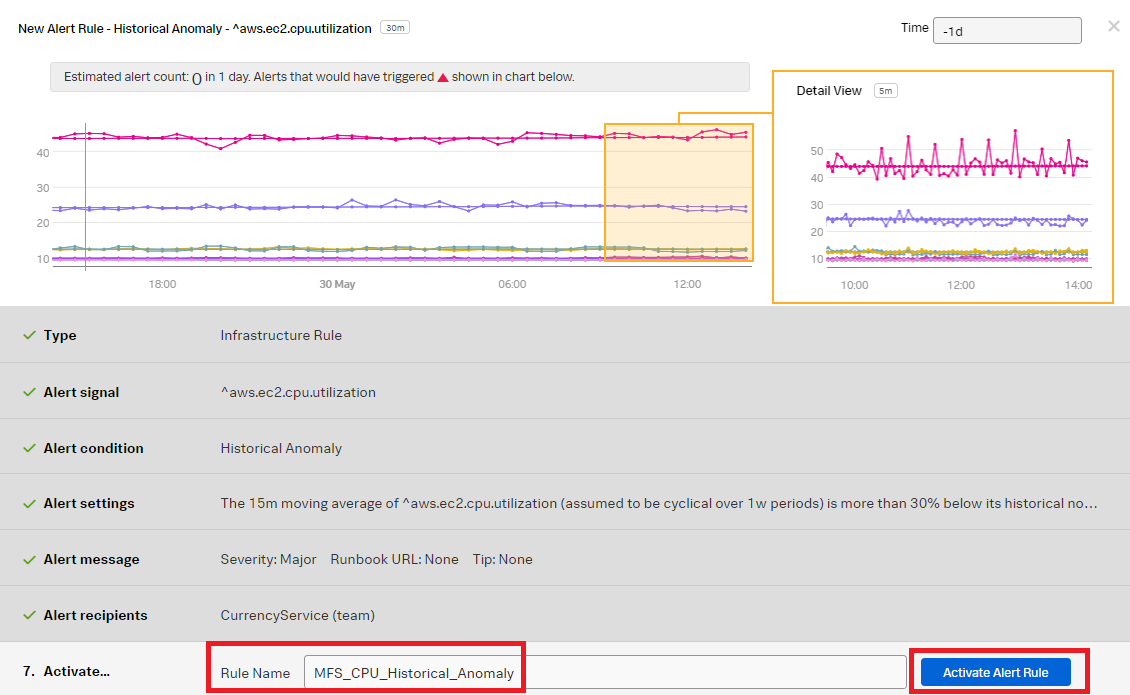
- Click Activate Alert Rule.
- In Splunk Observability Cloud, click Alerts & Detectors in the left navigation pane.

EC2 disk read/write operations
- ► Creating a detector in Splunk Infrastructure Monitoring to address disk operations scenarios
-
There are two different disk operations scenarios you might encounter while your EC2 instances are performing read/write operations on connected storage:
- DiskReadOps. The total completed read operations by the EC2 instance in a given period of time. If this metric deviates from the historical baseline average, there could be something wrong with the application running inside the instance.
- DiskWriteOps. The total completed write operations by the EC2 instance in a given period of time. If this metric deviates from the norm, there could be an application problem.
As the SRE responsible for the application’s operations performance, you need to be notified when disk reads or writes exceed standard deviations from normal.
- In Splunk Observability Cloud, click Alerts & Detectors in the left navigation pane.

- Click New Detector.
- Enter an appropriate name for the detector. The example below uses "Disk_Ops_Detector". Click Create Alert Rule to proceed.
- Select Infrastructure or Custom Metrics Alert Rule to create an infrastructure alert rule, and click Proceed To Alert Signal.
- In the Alert signal section:
- Add the "aws.ec2.cpu.write.total" metric.
- Click Add Analytics.
- Set to Sum > Sum:Transformation > Moving Window to 30 minutes.
- Click Proceed To Alert Condition.
- In the Alert condition section, select Historical Anomaly to alert when the signal is different from the same period in the past. Click Proceed To Alert Settings.
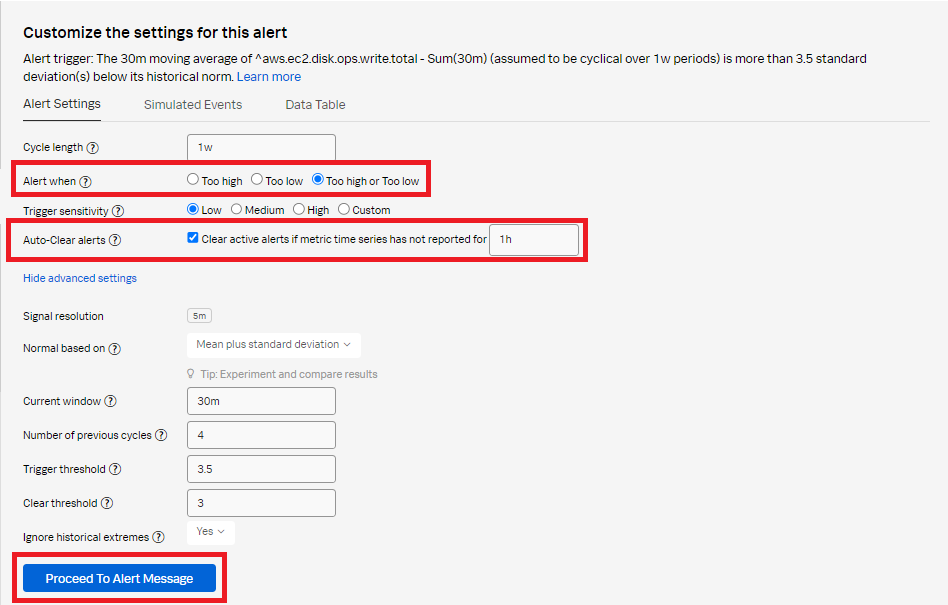
- In the Alert settings section:
- Set the alert when to Too high or Too low to alert when the signal is above or below the standard deviation.
- Select Clear active alerts if metric time series has not reported for and set it to 1h.
- Leave all other fields as default.
- Click Proceed To Alert Message.
- In the Alert message section:
- Set the alert Severity. You can choose from Critical, Major, Minor, Warning, or Info, depending on how you perceive the alert severity.
- Optionally, enter a Runbook or dashboard URL and enter a short tip for end users who might be troubleshooting the alert.
- Click Customize to further customize the alert message.
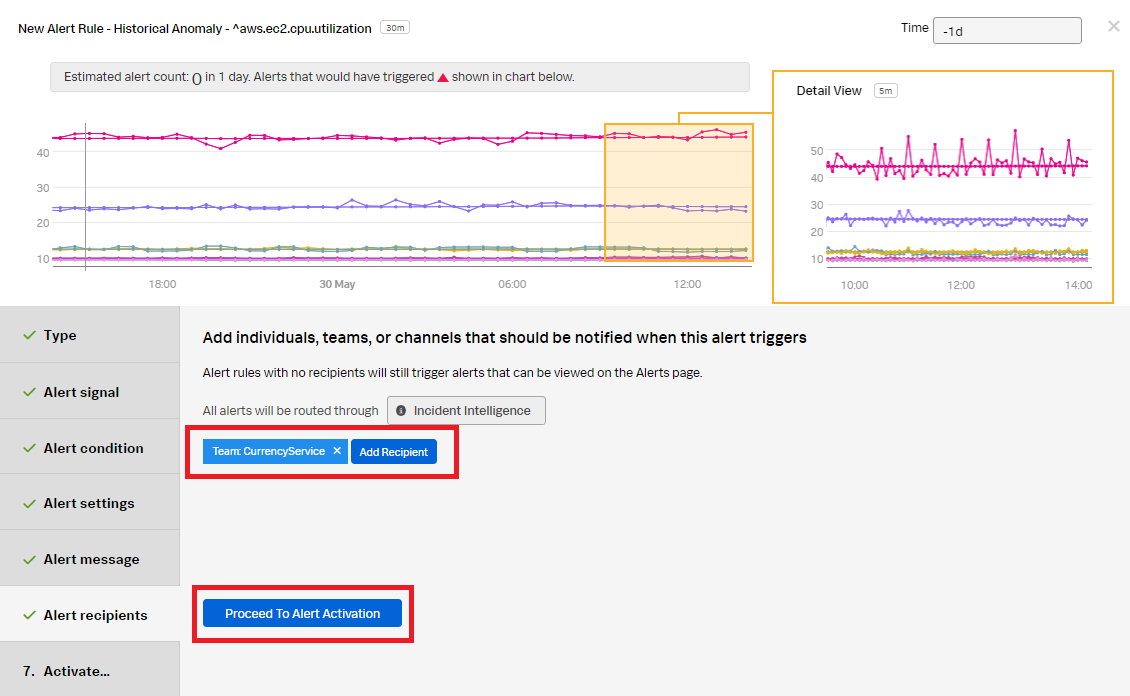
- Click Proceed to Alert Recipients.
- Click Add Recipient to customize the recipients to send the alert message to. You can choose to add an email address, a team, or a webhook. Click Proceed to Alert Activation.
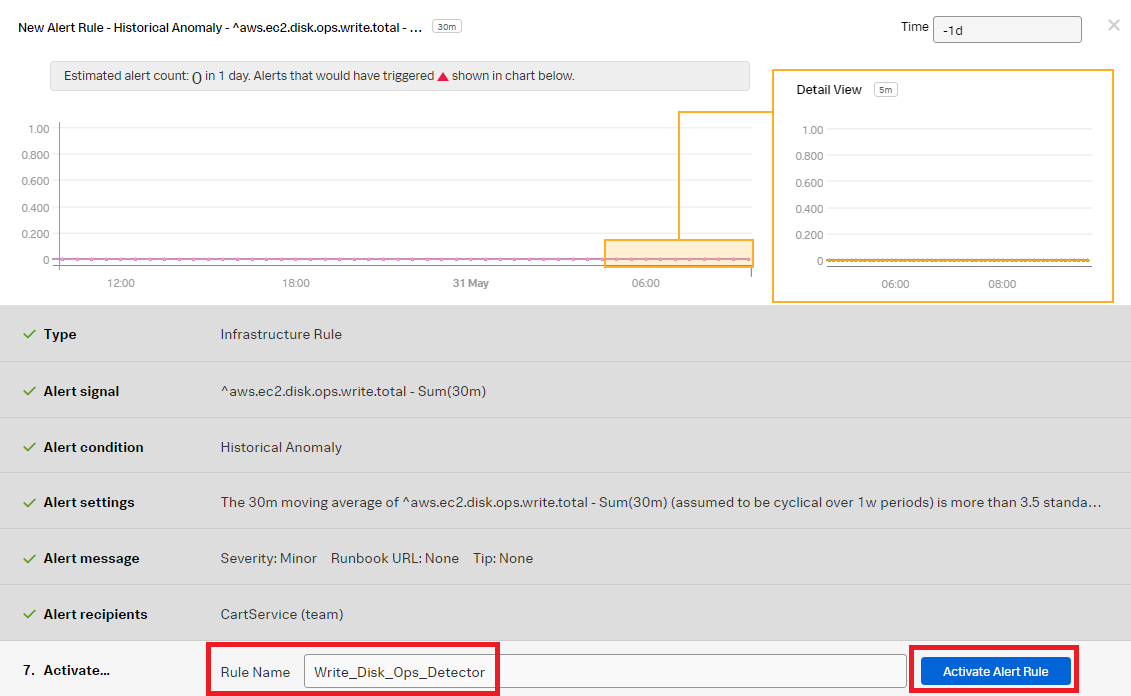
- Change the Rule Name to "Write_Disk_Ops_Detector" to indicate the rule is for the write operation. Click Activate Alert Rule.
- Start to create the alert rule for the read operation. Click the three dots ... then click Clone to clone the Write_Disk_Ops_Detector so you can quickly create the read rule. Click the cloned rule named "Write_Disk_Ops_Detector (Clone)".
-
Select Alert signal. Change the signal metric from aws.ec2.disk.ops.write.total to aws.ec2.disk.ops.read.total. Click Done.
-
Change the Rule Name to Read_Disk_Ops_Detector. Click Update Alert Rule.
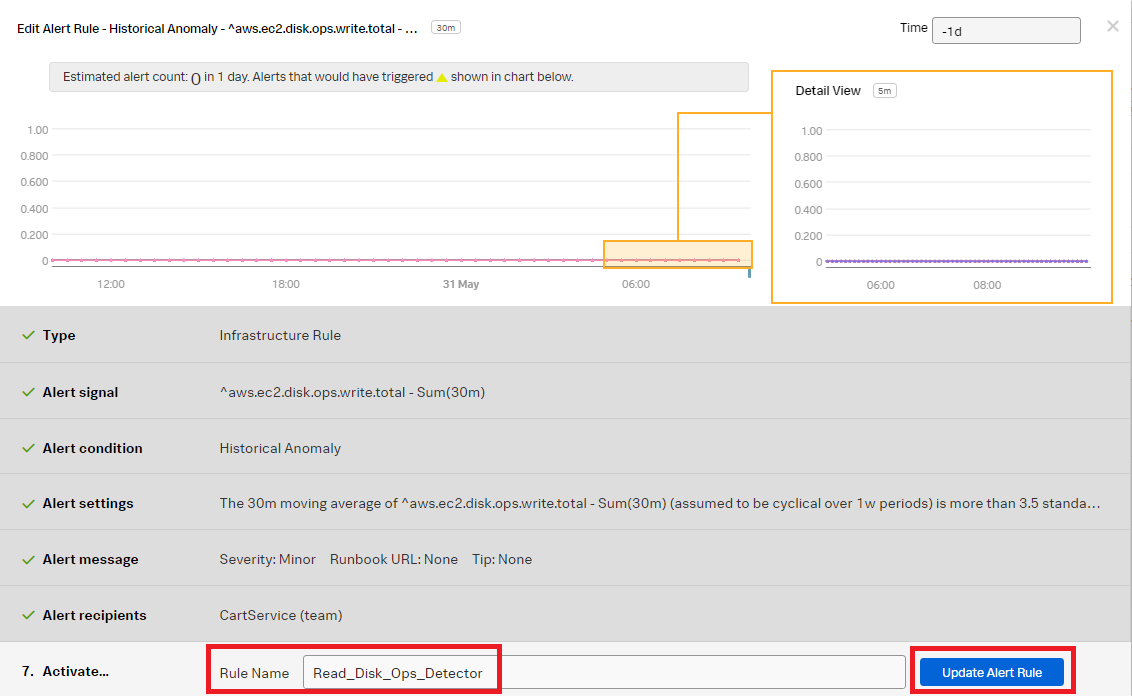
You now have rules that will alert on the AWS EC2 disk read and write operations anomalies and notify the defined alert recipients when appropriate.


Best practices for creating and managing detectors
- Before developing detectors, spend some time writing down your requirements and expected outcomes.
- Apply good naming conventions to detector names. Configure detectors and alert messages in a standard way. Establish operational practices, policies, and governance around standards.
- Make sure each detector alert has a clear SOP (Standard Operating Procedures) documented. This drives operational excellence.
- Use critical severity sparingly and only under special conditions requiring the highest level of intervention. Consistent standards are also important so that severity levels are interpreted in a consistent way by all consumers.
- Detectors require validation and ongoing tuning to remain relevant. Establish best practices around managing the lifecycle of a detector, from initial creation and onboarding to archiving or decommissioning.
Next steps
Still having trouble? Splunk has many resources available to help get you back on track.
- Splunk Answers: Ask your question to the Splunk Community, which has provided over 50,000 user solutions to date.
- Splunk Customer Support: Contact Splunk to discuss your environment and receive customer support.
- Splunk Observability Training Courses: Comprehensive Splunk training to fully unlock the power of Splunk Observability Cloud.