Leveraging crime statistics to improve public safety
Data about key statistics related to crimes can help law enforcement be prepared for what to expect when they respond to certain crimes. You want to help data analysts trend crime data to help prevent crimes from happening. Reduced crime provides better public perception, decreases working hours required to file reports, and enables teams to more efficiently deploy officers to be at the right places at the right times.
Required Splunk Apps:
- Maps+ for Splunk
- Calendar Heat Map - Custom Visualization
Optional Splunk Apps:
Required data
For general public use, anyone can download publicly accessible crime reports where available. This example use case uses the following data:
- Data from the Splunk Open Data Crime App.
- City of Chicago publicly accessible open data crime reports. When using data sets such as these, verify that the data includes latitude and longitude values for maximum usefulness.
- Internal state and local employee crime reports, exported to CSV format.
Procedures
The following searches are guidelines intended to help you get started. Depending on your data set, you may need to change field names or parameters. You can optimize the searches by specifying a time range.
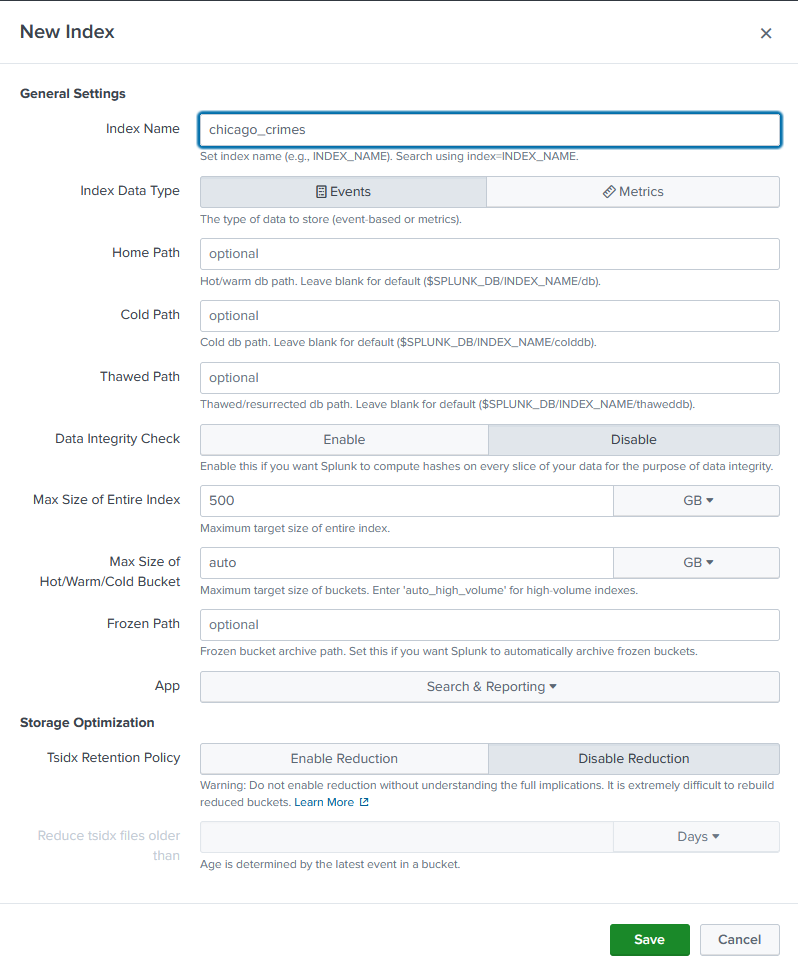
Create a new index
In your Splunk deployment, go to Settings > Indexes > Create Index. Add a name (in this case, chicago_crimes) and leave the default settings.
Upload data
- Upload the CSV file from the link above to a folder on your Splunk server. Note the file path location.
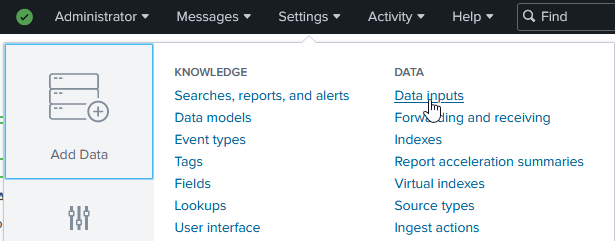
- In your Splunk deployment, go to Settings > Data Inputs.
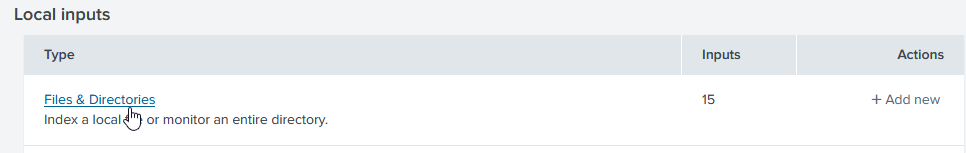
- Click Files & Directories.
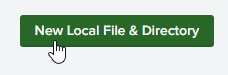
- Click New Local File & Directory.
- Browse to the location to the uploaded file, select it, and click Index Once.
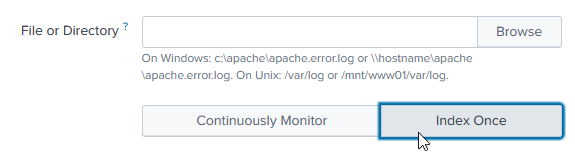
Depending upon storage and processing speeds, this large data set can take a few minutes to ingest.
Create reports
To following along with these recommendations for building reports and dashboards, create a new Dashboard in Splunk, select "Classic" style dashboard, copy/paste the following and save: https://github.com/splunk/public_safety/blob/main/splunk_chicago_crime_dashboard_example.xml. If you need more help, refer to the dashboard documentation for Splunk Enterprise or Splunk Cloud Platform.
Time range
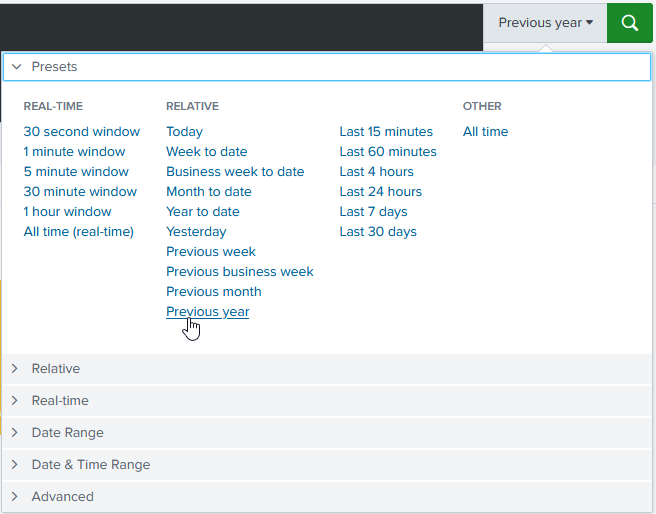
When building a report to help your agency analyze crime statistics and patterns in your jurisdiction, the first step is to pick an appropriate time range. Use the time picker on the right-hand side of the search bar.
Searching long ranges of time or "All Time" can significantly impact the the time it takes to return results.
Values
Next, you might be interested in reporting on some of the following summary values.
- Total number of crimes reported. This value can help you staff your department appropriately to be able to respond.
index=chicago_crimes Arrest=* "Primary Type"="*" Description="*"  Ward=*
| stats count AS "# of Reported Crimes"
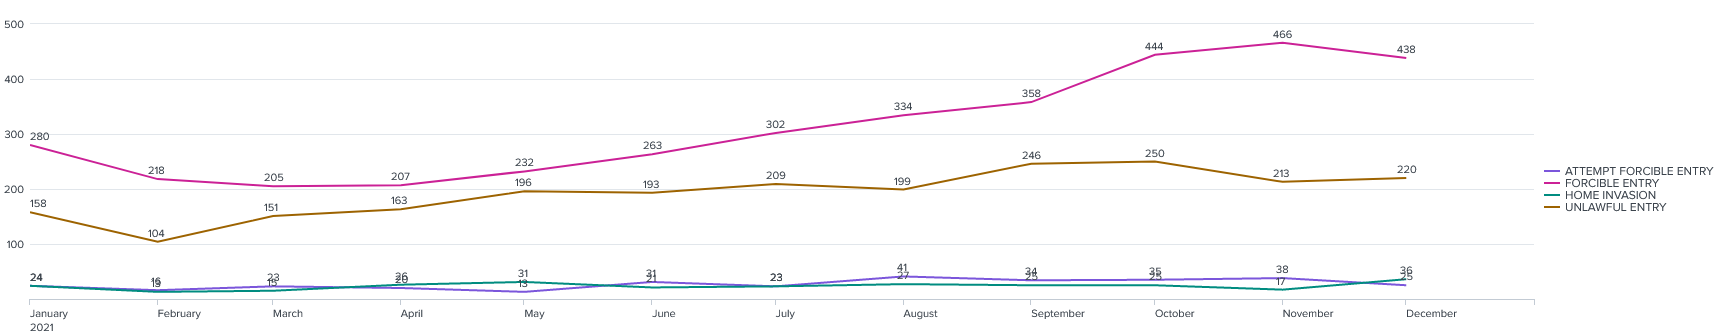
- Crimes reported over a specific time period. By adding a trendline for easy visualization, you can quickly see the influence of any crime reduction efforts or events that cause an increase in crime.
index=chicago_crimes Arrest=* "Primary Type"="*" Description="*"  Ward=*
| timechart span=1month count AS "# of Reported Crimes"
- Ratio of reported crimes to arrests. You might be interested in tracking this value over time to demonstrate the efficacy of your department.
index=chicago_crimes "Primary Type"="*" Description="*"  Ward=*
| stats count BY Arrest
Filtered dashboards
The values in your reports can be shown overall, but you can also add filters to a dashboard to show these values for specific crimes, neighborhoods, beats, or any other value contained in your data set.
For help creating dashboards, try the Splunk Dashboard Studio Examples Hub.
Parsing and combining data
You can also parse and combine the data in multiple ways on your dashboard and apply visualizations.
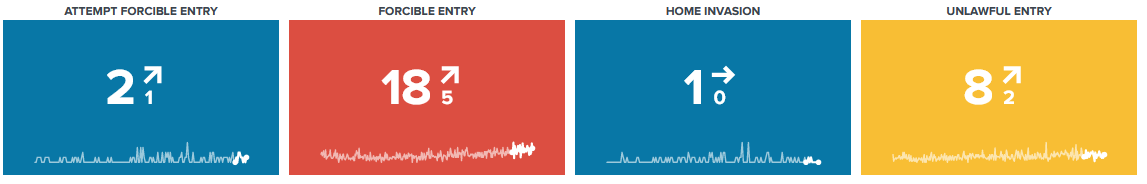
For example, you might want a longer, day-by-day timeline than the one shown on the dashboard above, broken down by ward.
index=chicago_crimes  Arrest=* "Primary Type"="BURGLARY" Description="*"  Ward=*
| timechart count by Description
Trends can be shown daily, weekly, monthly, or at an interval you choose.
index=chicago_crimes  Arrest=* "Primary Type"="BURGLARY" Description="*"  Ward=*
| bucket _time span=1d
| stats count BY _time, Description
| stats avg(count) AS AverageCountPerDay BY _time, Description
| eval AverageCountPerDay=round(AverageCountPerDay,0)
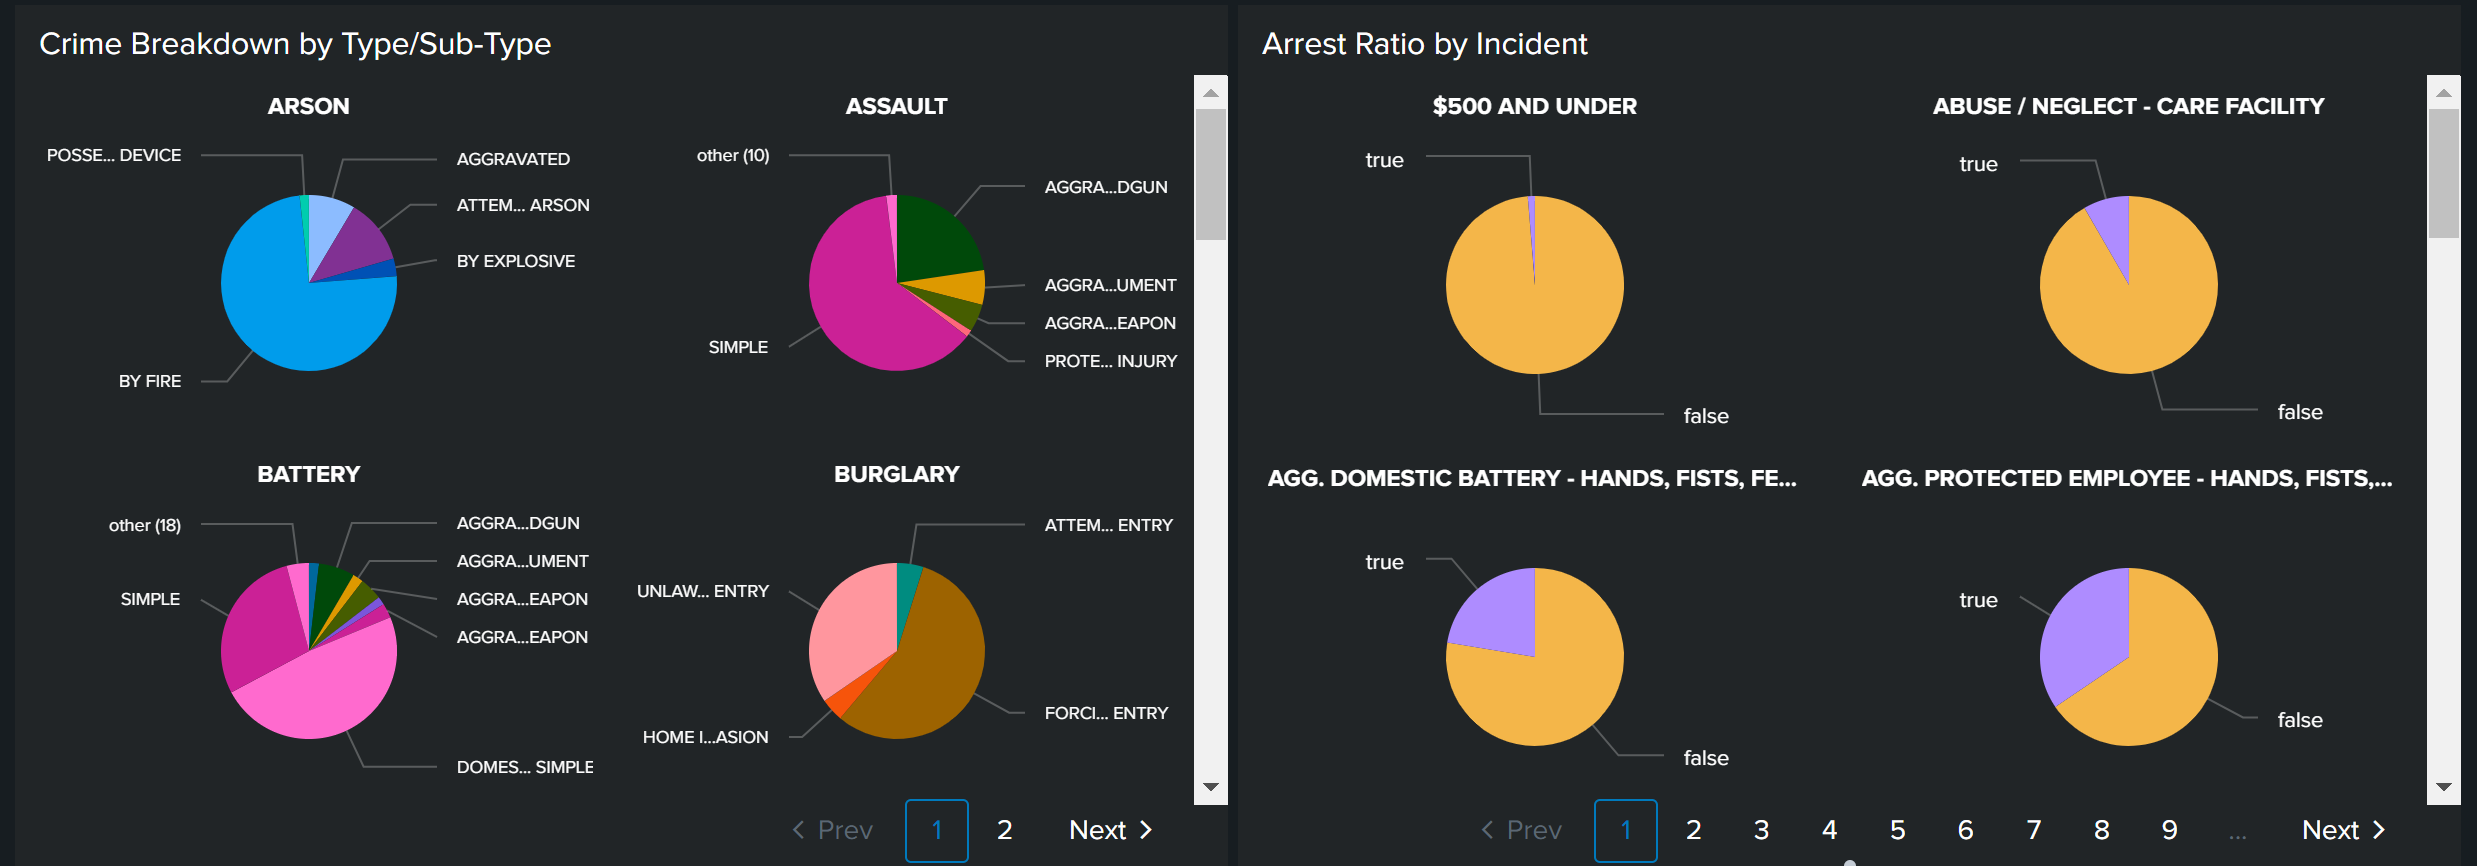
Or you might want to break down total crimes into type (such as arson) and subtype (such as by explosive versus by fire).
index=chicago_crimes Arrest=* "Primary Type"="*" Description="*"  Ward=*
| stats c BY "Primary Type", Description
You might also want to break down your arrest ratio by crime type to see where your staff needs more training or to demonstrate high levels of effectiveness in more serious crimes.
index=chicago_crimes "Primary Type"="*" Description="*"  Ward=*
| stats c BY Description, Arrest
Maps
Finally, crime statistics can also be visualized with a map. Seeing higher rates in certain areas can help with police staffing - making sure the right number of officers are in certain areas to keep the peace and be available to respond to calls.
index=chicago_crime Arrest=* "Primary Type"="*" Description="*"  Ward=* Latitude>0 OR Longitude>0
| dedup "Case Number"
| eval markerColor=case(like(Description, "%SIMPLE%"), "red", like(Description, "%DOMESTIC BATTERY%"), "pink", like(Description, "%500 AND UNDER%"), "green", like(Description, "%TO PROPERTY%"), "orange", like(Description, "%RETAIL THEFT%"), "darkred", like(Description, "%TO VEHICLE%"), "cadetblue", 1=1, "blue"),
icon=case(like(Description, "%SIMPLE%"), "exclamation-triangle", like(Description, "%DOMESTIC BATTERY%"), "battery-2", like(Description, "%500 AND UNDER%"), "gavel", like(Description, "%TO PROPERTY%"), "building", like(Description, "%RETAIL THEFT%"), "shopping-cart", like(Description, "%TO VEHICLE%"), "car", 1=1, "hand-lizard-o"),
layerDescription=case(like(Description, "%SIMPLE%"), "exclamation-triangle", like(Description, "%DOMESTIC BATTERY%"), "battery-2", like(Description, "%500 AND UNDER%"), "gavel", like(Description, "%TO PROPERTY%"), "building", like(Description, "%RETAIL THEFT%"), "shopping-cart", like(Description, "%TO VEHICLE%"), "car", 1=1, "hand-lizard-o")
| rename "Primary Type" as PrimaryType, "Location Description" as LocationDescription
| eval description = "<b>Incident Date:</b>" +Date+"<b><br>"+PrimaryType+"</b><br>"+Description+"<br>Arrest: " +Arrest+"<br>"+LocationDescription, tooltip=description, clusterGroup="default"
| rename Latitude as latitude, Longitude as longitude
| table latitude, longitude, description, tooltip, markerColor, icon, clusterGroup, layerDescription
For help creating map visualizations, try the Maps+ for Splunk app.
Next steps
As you mature in your use of crime data, you might be interested in doing advanced AI-based prediction models/analytics against these kinds of data sets. Splunk provides apps to help with this: