Optimizing performance in canary development environments with Splunk APM's custom MetricSets
As part of your DevOps lifecycle, you use canary deployment methodology and introduce new versions of microservice code releases on a daily basis, with hundreds of microservices being updated by multiple development teams. Canary deployment is beneficial for your organization as it allows for phased rollouts with lessened impact on user experiences. However the increased complexity that comes through this methodology poses challenges and risks.
In this complex environment, you need to be able to easily identify and visualize the application impact of your code releases so that failed releases can be quickly identified, rolled back and remediated.
Two different types of roles perform different tasks in this scenario:
- If you're an SRE, you need to accelerate the ability to identify application degradations caused from microservice releases introduced downstream.
- If you're a service developer, you need to accelerate your ability to quickly identify degradations (MTTD) for your service release deployments. You also need to understand what business applications and workflows are impacted and quickly restore them (MTTR) to minimize risks to the business.
It's important that both roles can work on a shared system that allows them to visualize the services affected by your canary deployments.
How to use Splunk software for this use case
You can use create custom MetricSets to add span tags to Splunk Application Performance Monitoring for your release versions and app names, so you can visualize and correlate them across common traces. This helps you improve mean time to detect (MTTR) and mean time to resolve (MTTR), as well as mitigate the business risks that can stem from using canary or blue/green deployment methodologies. Custom MetricSets help you to drive operational optimization and excellence within your organization.
The procedure you'll follow is:
- Learn about the scenario used in this article
- Create custom MetricSets
- Create a Splunk Application Performance Monitoring MetricSet for the "version" tag which is instrumented in all microservices as a standard. This lets you see version information in the Splunk Application Performance Monitoring service map and Tag Spotlight.
- Create a Splunk Application Performance Monitoring MetricSet for the "app_name" tag which is instrumented on the frontend service for all apps. This lets you see app name information in the Splunk Application Performance Monitoring service map and Tag Spotlight, as well as see the app name propagated across traces.
- Check APM for the new version and app_name tags.
- Follow a SRE investigation into microservice performance degradations.
- Follow a service developer investigation and remediate the canary release issues.
Scenario information
In the example used in this article, the environment is configured in a number of different ways:
- A new version of the application, v350.10, has just been released as part of the canary-based deployment methodology.
- The online sales portal is deployed into a Kubernetes cluster, monitored by Splunk Infrastructure Monitoring.
- The "frontend" service is the main entry point gateway for the online sales portal.
- The Splunk Application Performance Monitoring "version" tag is instrumented for all services. The APM "app_name" tag is also instrumented for all top-level application microservices. However, if you have not yet done this and you need to instrument your applications with these custom tags in your Kubernetes helm chart deployment YAML, do the following:
- In the highlighted entry, set the app_name tag for the frontend microservice. You only have to instrument this at the frontend service since you will create a global type index. The global type makes the app_name available to downstream services involved in a trace originating at the frontend service. This is a powerful feature of APM and is made available at full fidelity. If the service owner looks at a downstream shared service, they can easily understand what application originated the trace without requiring the service to expose the tag.
- Instrument the version tag in the same way on each individual microservice.
-

Create custom MetricSets
Create a Splunk Application Performance Monitoring MetricSet for the "version" tag
In this step you'll configure the span tag for "version", so the current version of the microservice can be visualized and correlated across common traces. This means that SREs or developers can quickly spot a degradation in the service error rate or performance, specific to a deployed version of the workload.
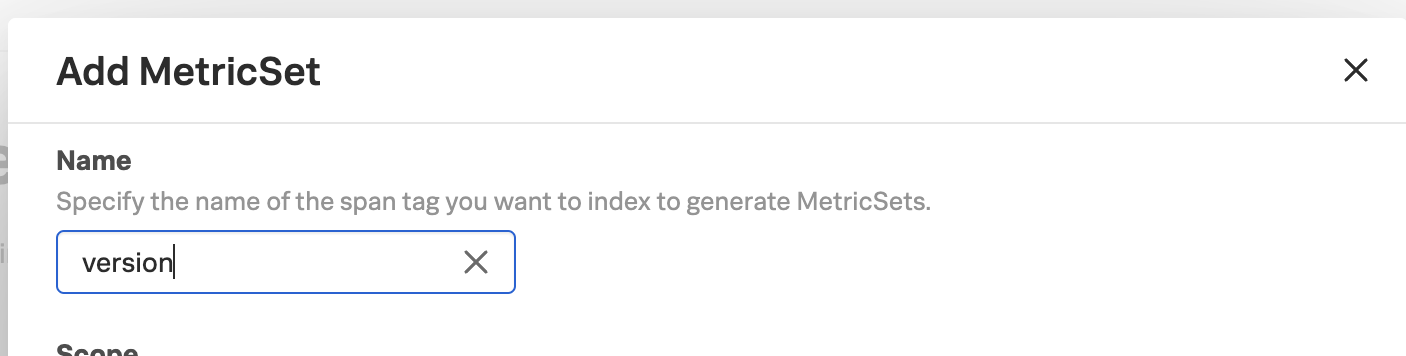
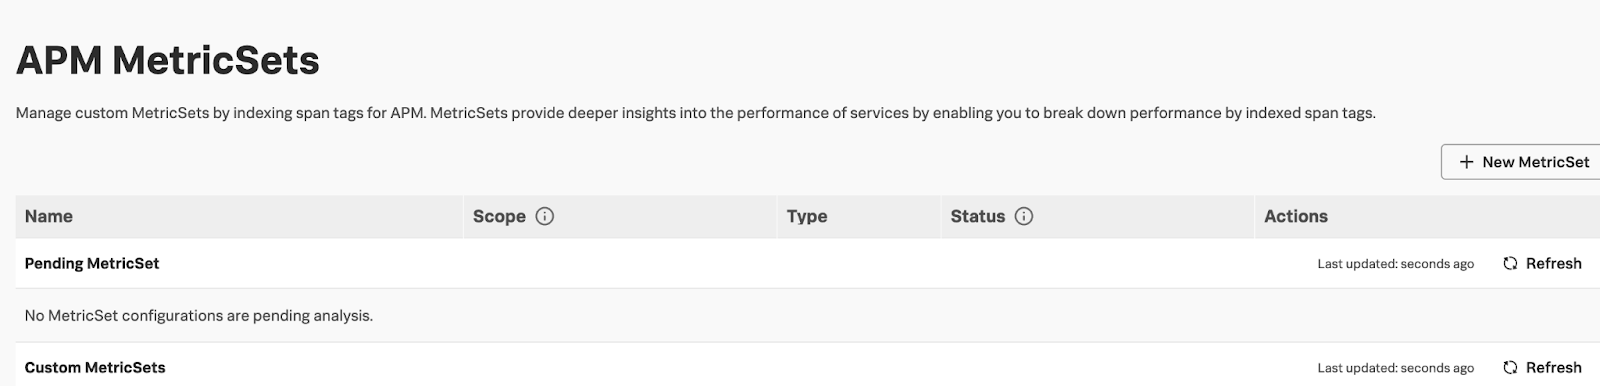
- Open Splunk Observability Cloud and click Settings > APM Metricsets. Click the New MetricSet button.
- Enter "version" in the Name field.
- Select the Service option. The Service option creates an index for all services so you can visualize the "version" tag as a panel in the service map and Tag Spotlight. Keep the default setting of "All Services". Do not select "Also create Monitoring MetricSet", as this creates unwanted MMS data points for the extra version dimension.
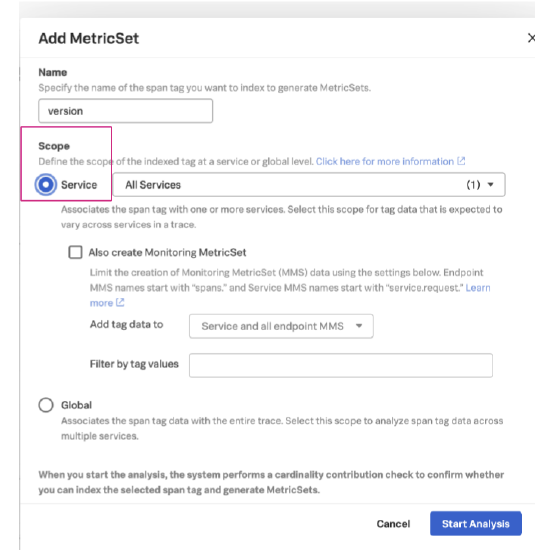
- Click the Start Analysis button. The system then starts to analyze the cardinality that will be applied by incorporating this configuration.

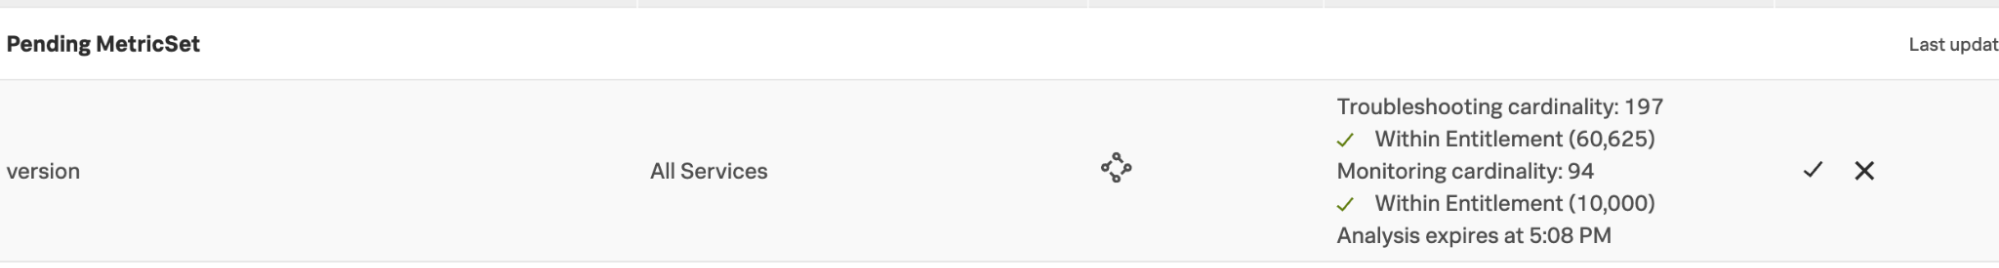
- After the analysis is completed, the system shows the analysis with "Troubleshooting" and "Monitoring" cardinality projections. A band called "Pending MetricSet' is also created, indicating the configuration is pending and requires an activation.
- After you have reviewed and accepted the cardinality implications, click the check mark to accept the configuration.
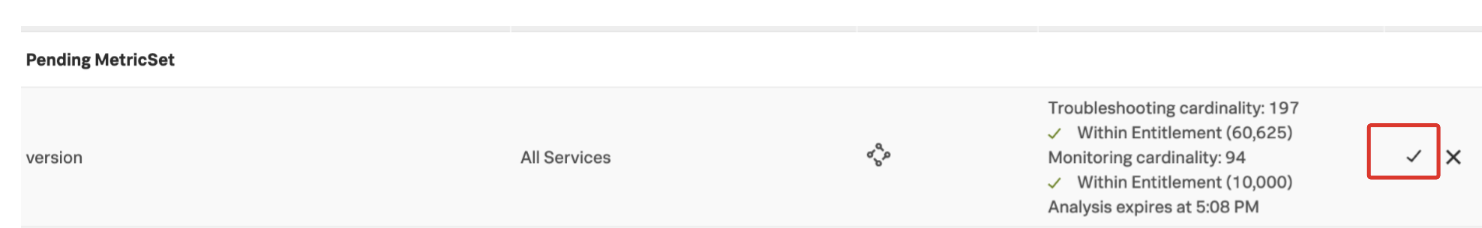
- Click Continue.
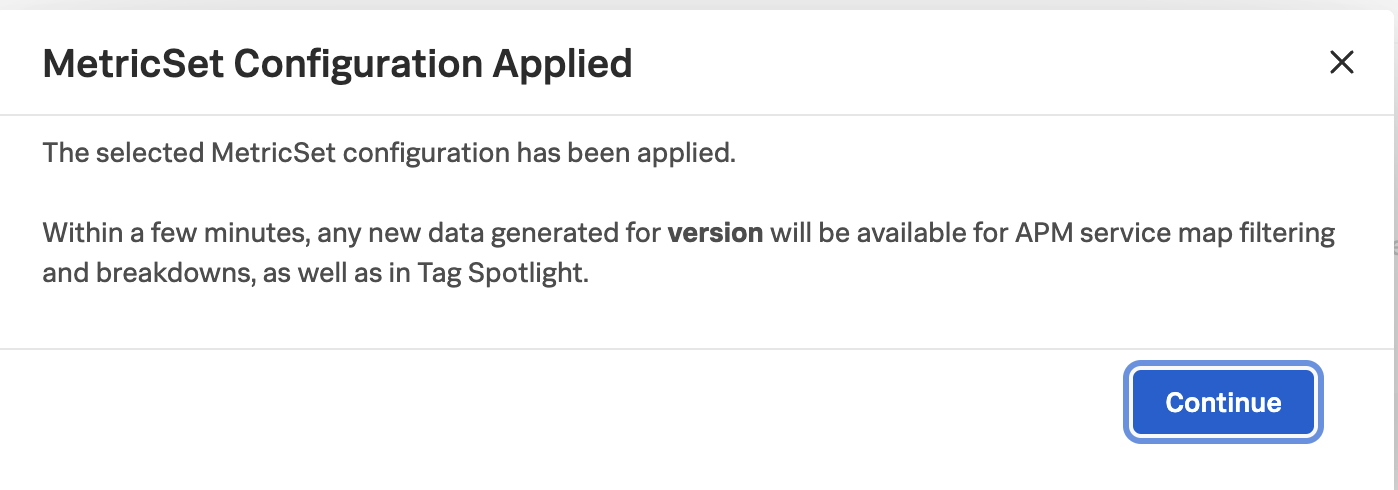
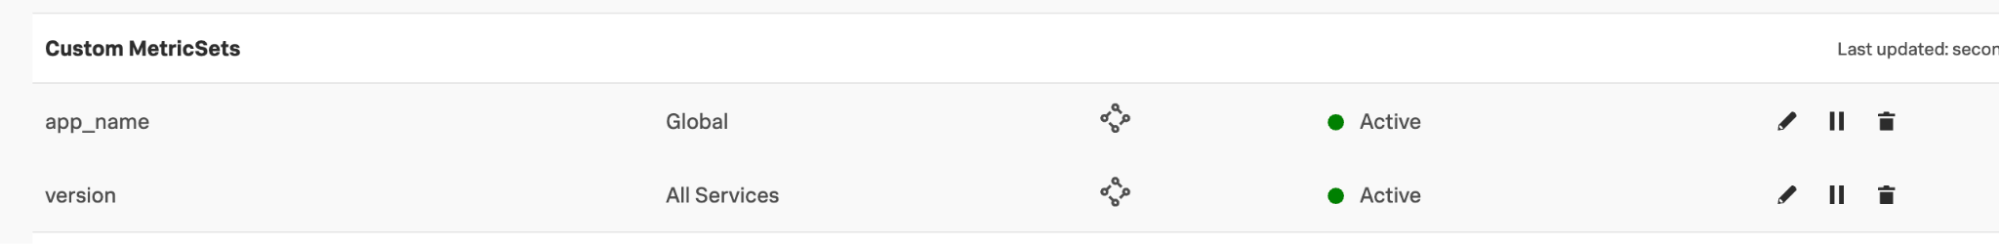
This transfers the configuration from the "Pending MetricSet" band to the "Custom MetricSets" band in the UI. You can see that the "version" is marked as "active". This means that the index has been applied and the "version" tag can now be visualized in the service map and Tag Spotlight.
Create a Splunk Application Performance Monitoring MetricSet for the "app_name" tag
In this step, you'll configure the span tag of "app_name" associated with the front end applications as an APM MetricSet global type. This makes the "app_name" tag globally available to each span in a trace, so service developers can see what applications are impacted by their canary version service deployment.
- Perform the same process you just followed to create a Splunk Application Performance Monitoring MetricSet for the "version" tag, with two changes:
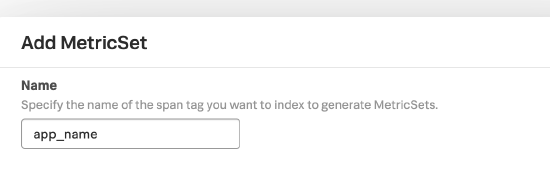
- Under Add MetricSet, enter "app_name" in the Name field.
- Under the Scope options, select Global instead of Service.
- Under Add MetricSet, enter "app_name" in the Name field.
After you have performed the cardinality analysis and applied the configuration, you should see that the new "app_name" MetricSet, like the "version" MetricSet, is also listed under Custom MetricSets and marked as "active".
Check Splunk Application Performance Monitoring for the new version and app_name tags
Now that you've added the new custom MetricSets, you can review them in Splunk Application Performance Monitoring to get familiar with where you can now see them and work with them.
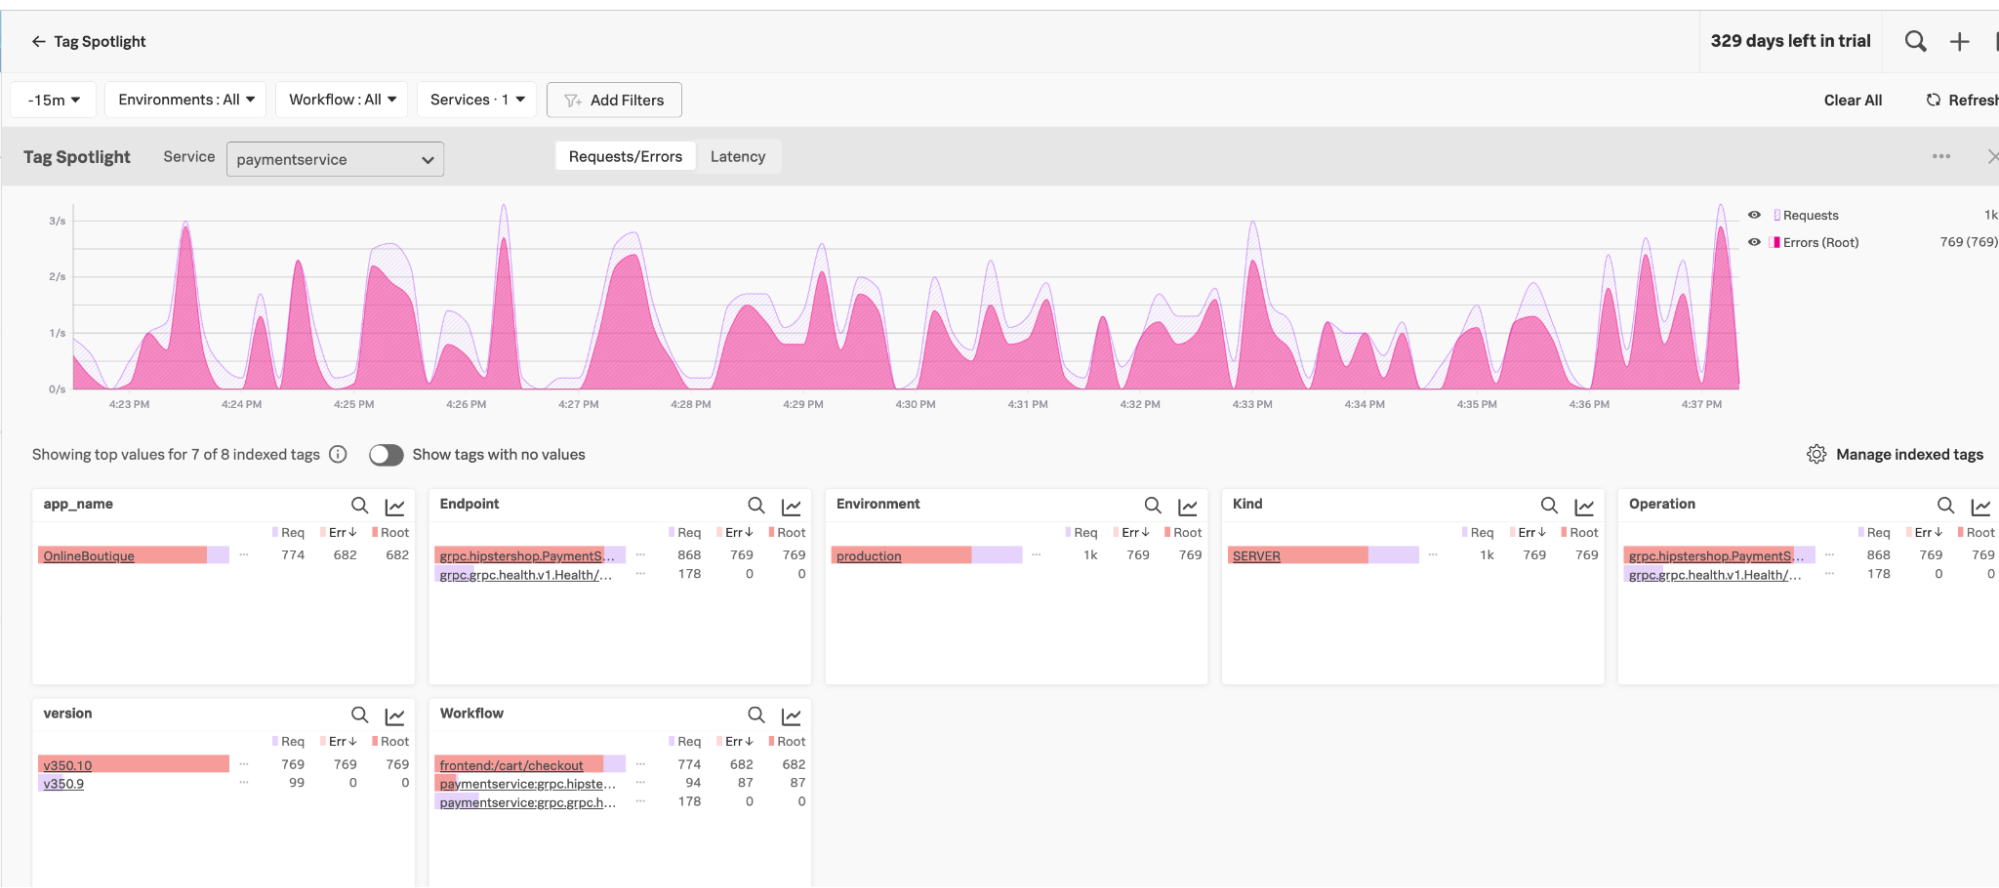
- Go to Splunk Application Performance Monitoring and click Tag Spotlight.
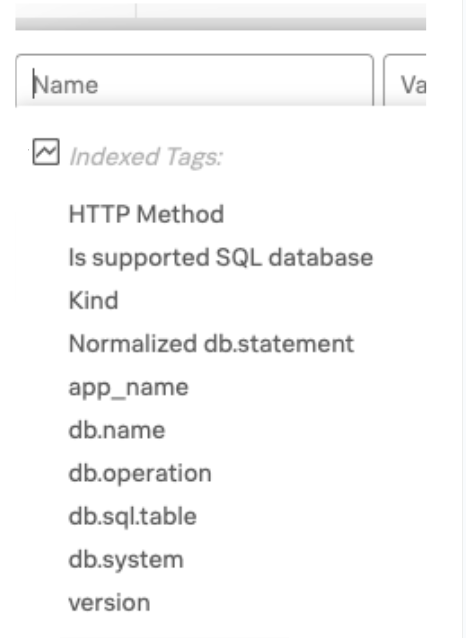
- Go to the top of the Tag Spotlight UI and click the Add Filters dropdown.
- Under Indexed Tags, note that app_name and version are listed. This means that the indexes have successfully been configured.
- In the Tag Spotlight UI, click to select the paymentservice. The new app_name and version tags will be visible in the UI. In this example, you can see a single application listed. In your organization, this area may contain multiple applications consuming the paymentservice. Also in this example, there are 2 versions that can be filtered on.
- In the Requests/Errors chart that shows traces over time, click a spike.
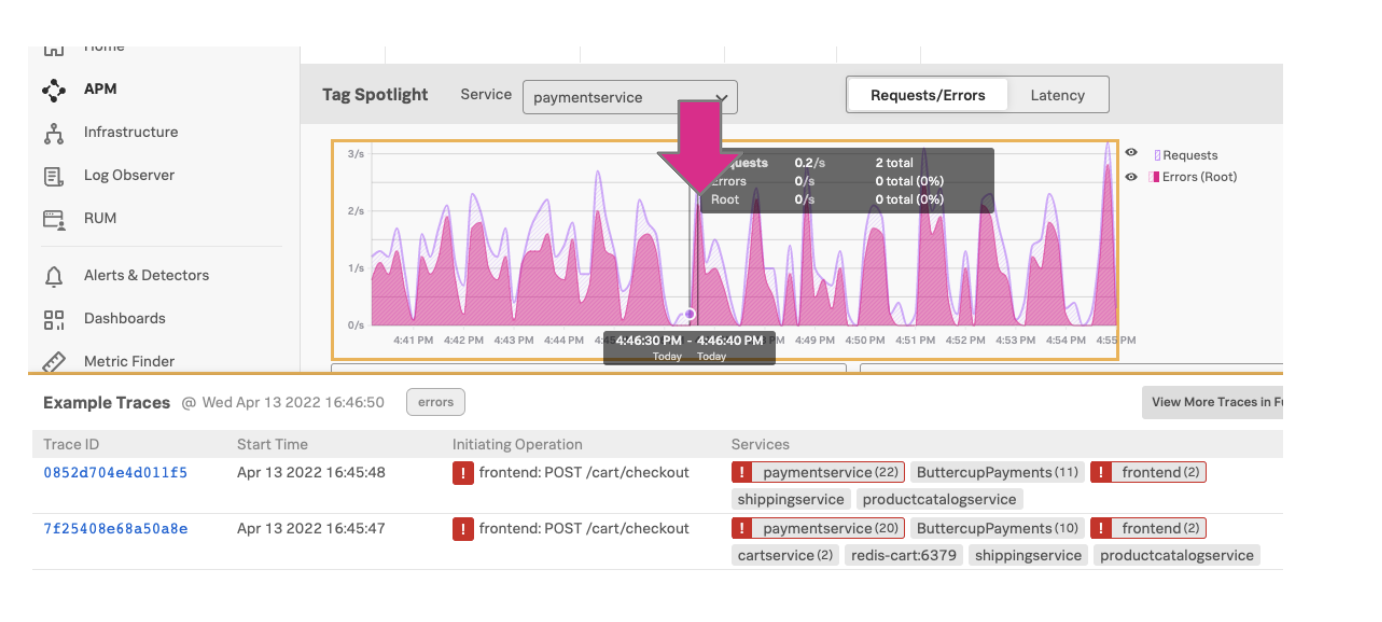
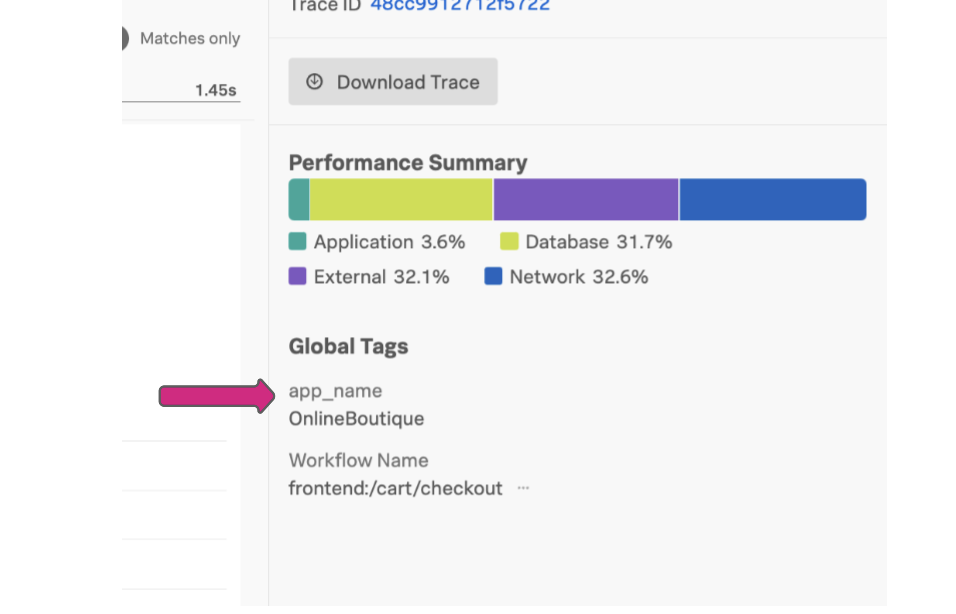
- You can see that the app_name tag is listed under Global tags on the trace you have selected.
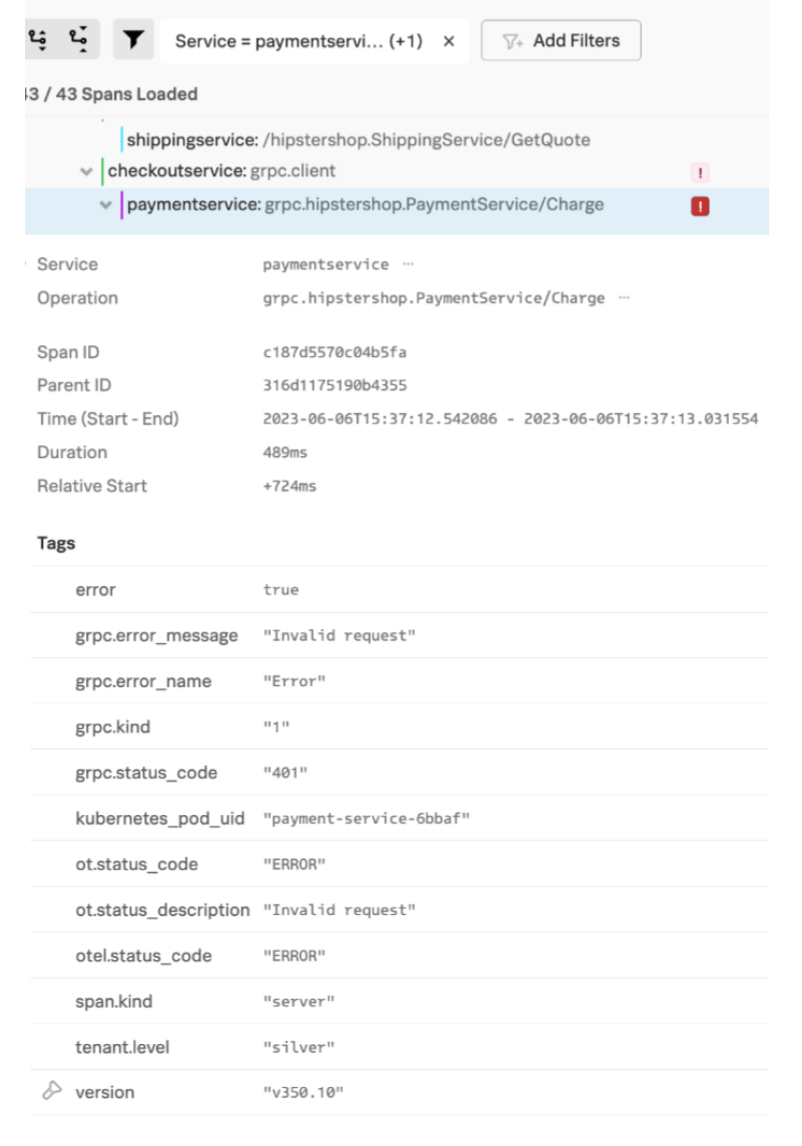
- For the version tag, select and expand the paymentservice metadata in the span of the trace. The version tag is visible in the tags listed there, in this example, at the bottom of the screenshot. The flashlight icon next to the version metadata tag shows this is being monitored as a Splunk Application Performance Monitoring custom MetricSet.
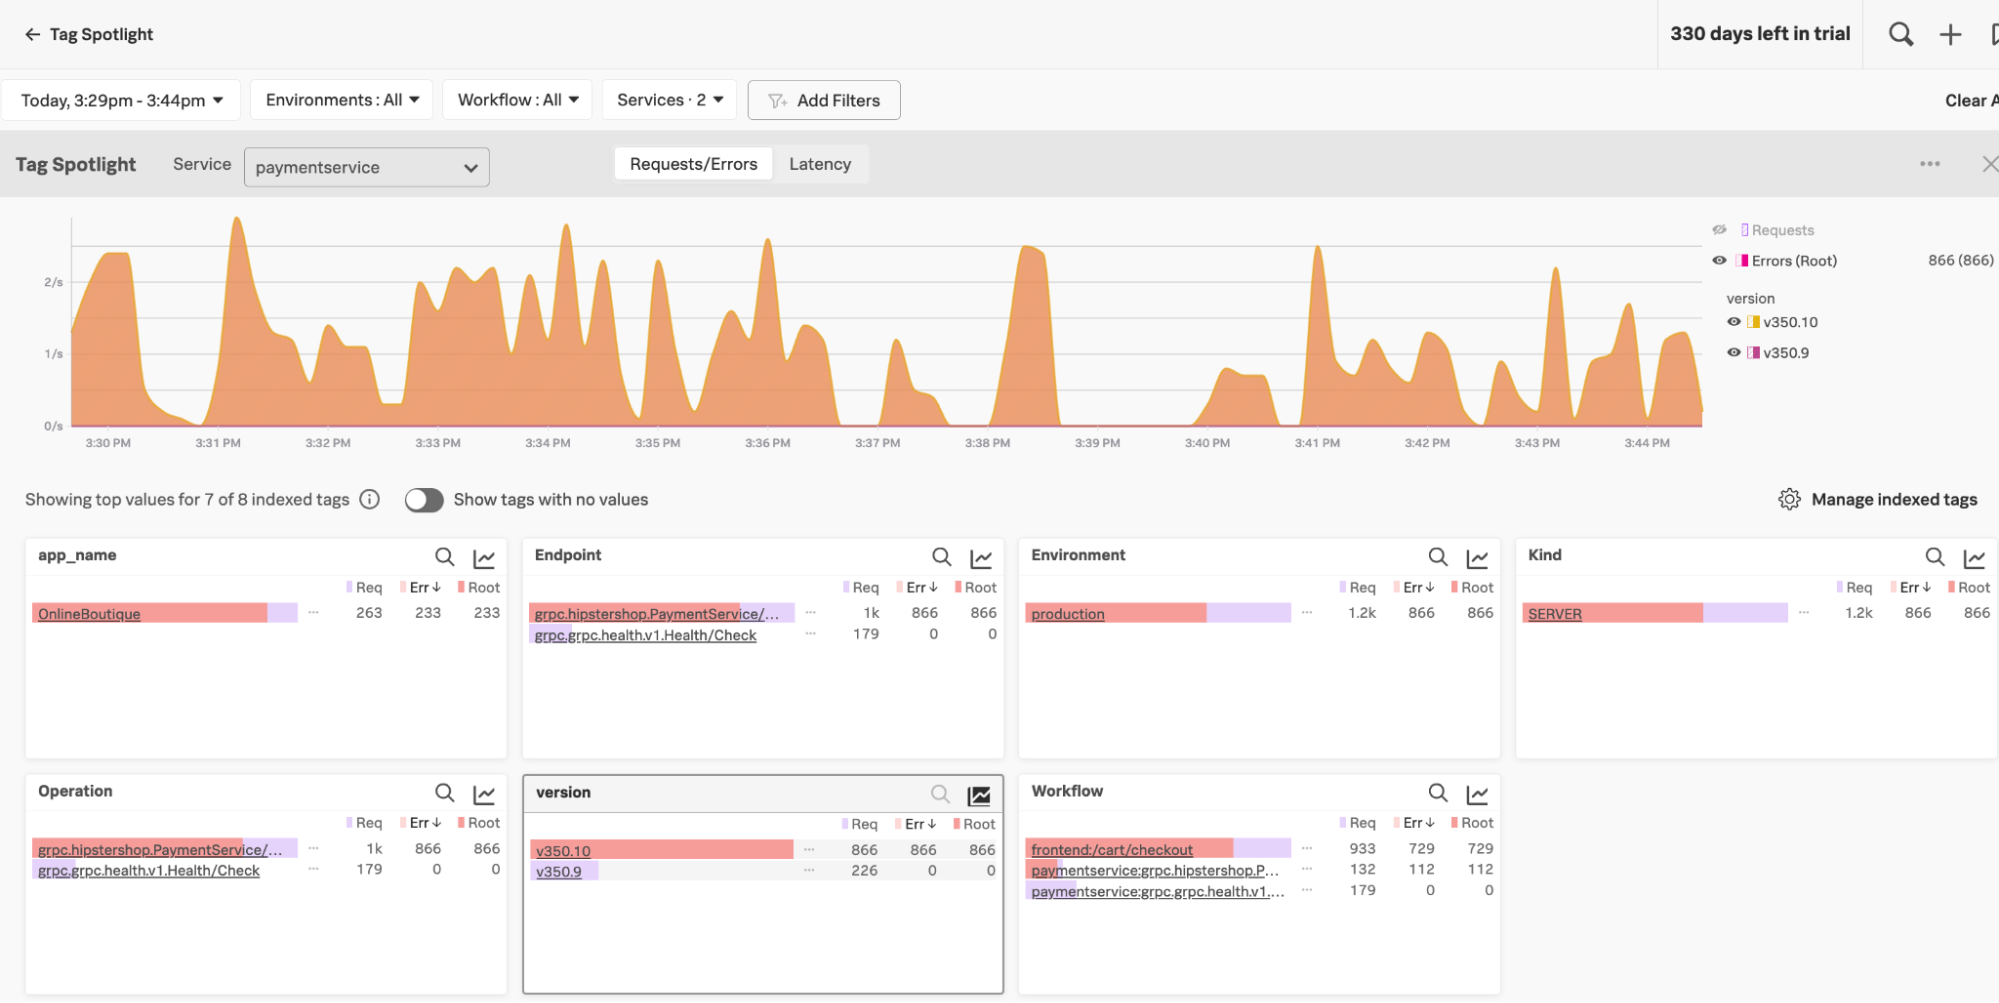
- To view the metrics associated with the span that will help you troubleshoot further, click the flashlight icon to go to the Splunk Application Performance Monitoring Tag Spotlight with this trace selected. In the screenshot below, the version panel shows you that version 350.10 is experiencing a high error rate compared to version 350.9, helping you quickly identify that the canary version is causing problems.


Now you've created your custom MetricSets, your SREs and service developers can use them to identify and resolve performance degradations stemming from your canary deployments.
SRE investigates microservice performance degradations
Now, imagine your SRE is notified by a deployed detector that the online sales portal performance has degraded. The error rate has elevated from normal. The SRE would take the following steps.
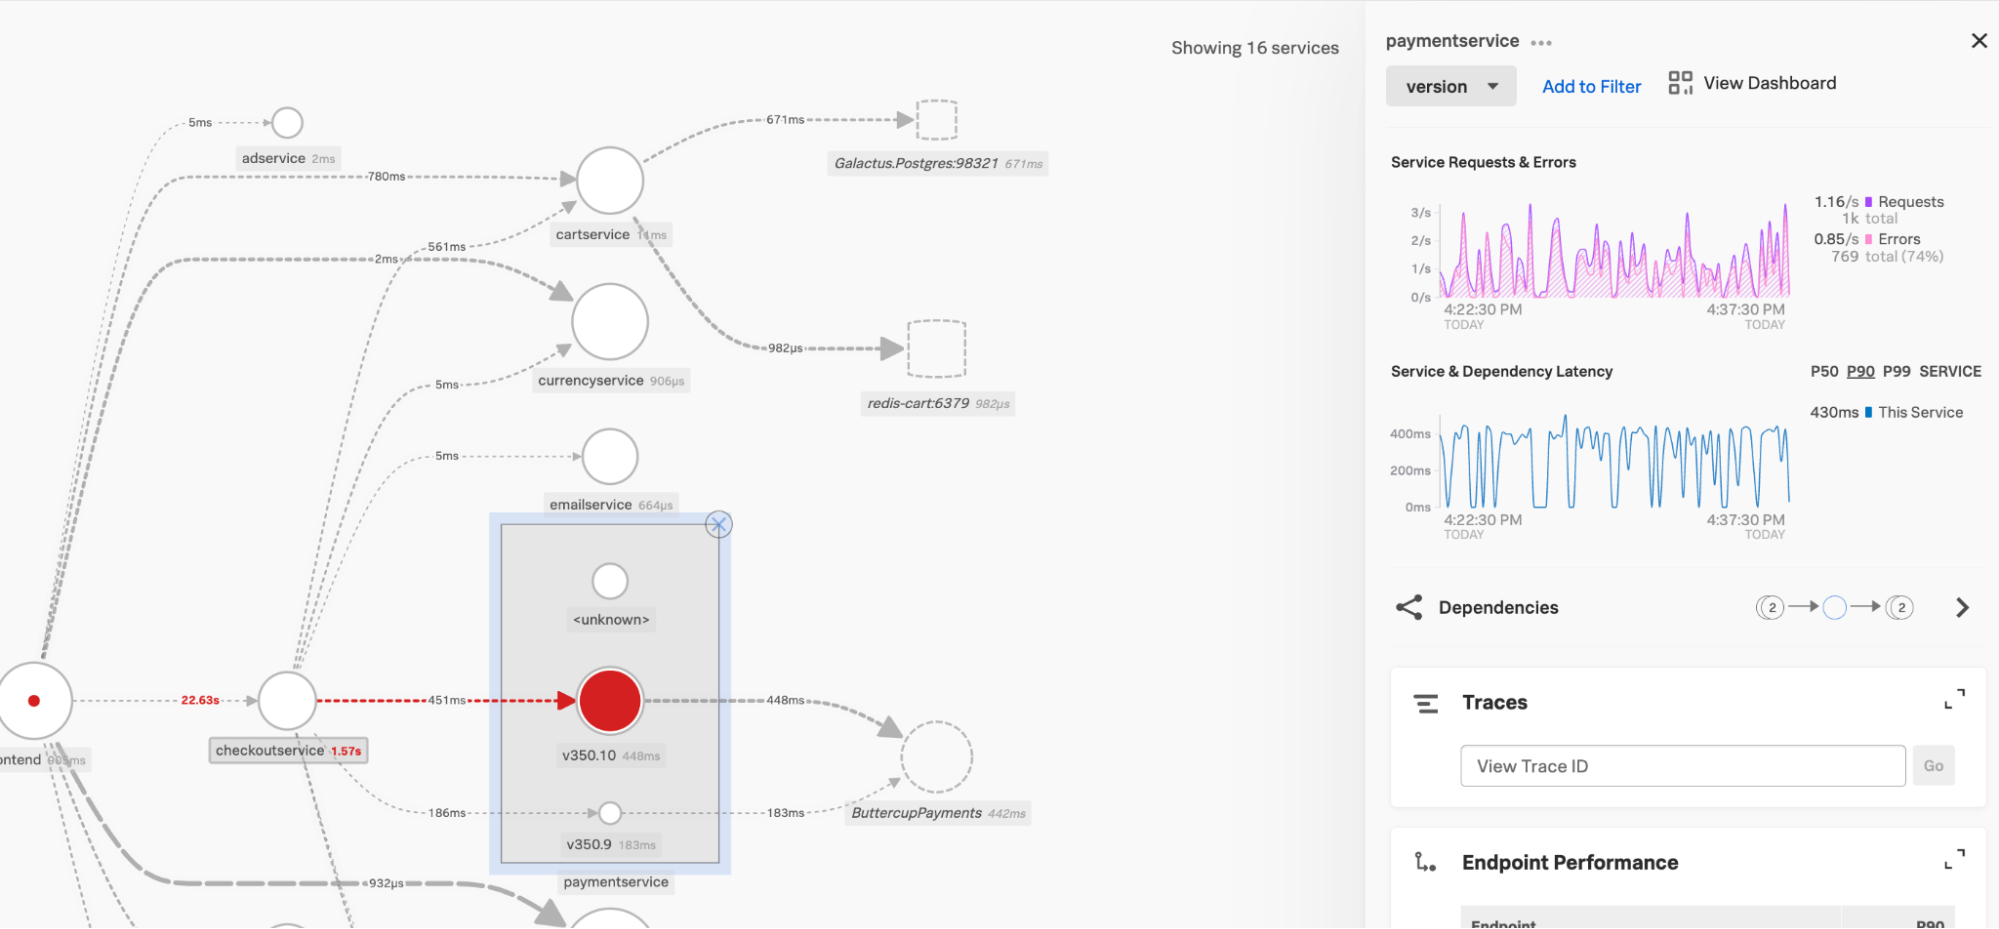
- In Splunk Application Performance Monitoring, open the service map. In this example, downstream from the frontend service, the paymentservice is experiencing a high error rate. Click paymentservice to investigate further.
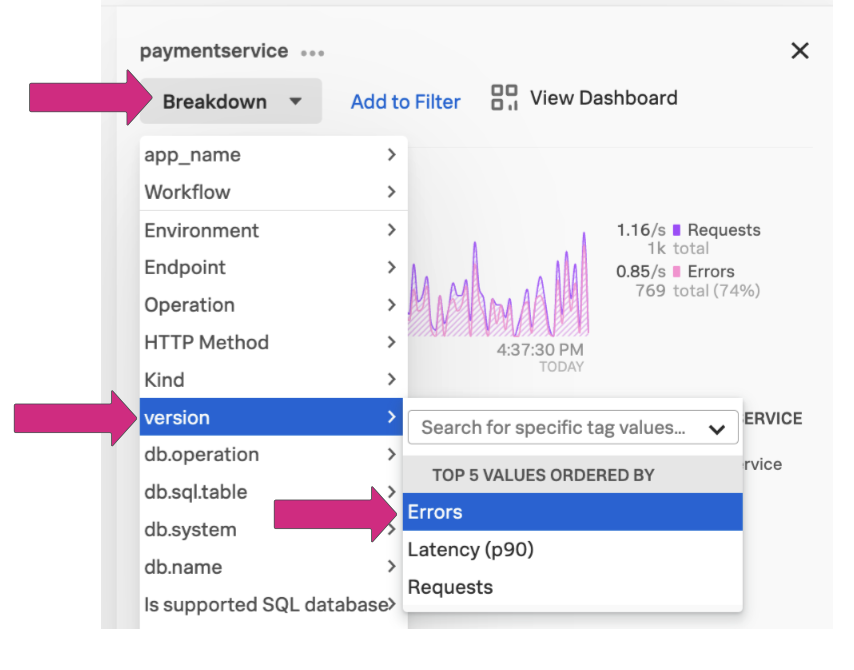
- Click the Breakdown dropdown, then select version and Errors.
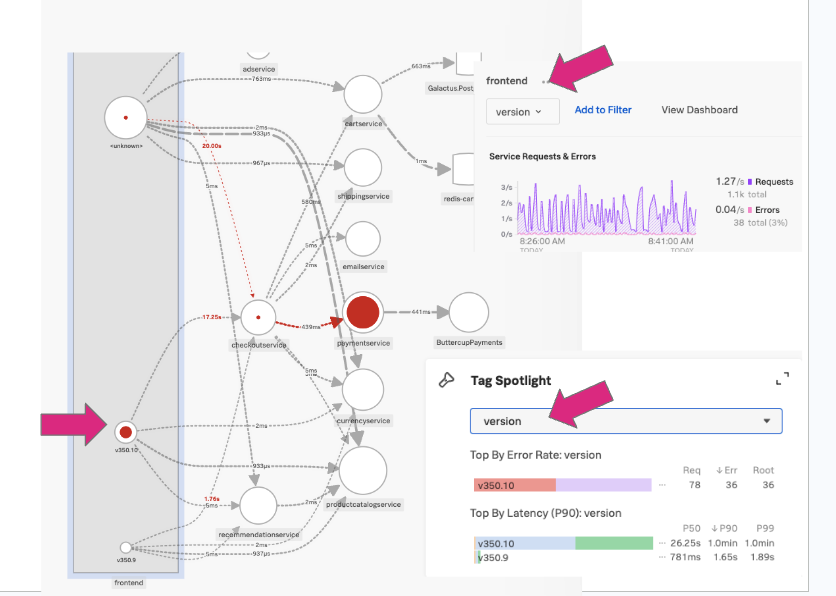
- The service map reloads to show the context of the breakdown. In the boxed area of the screenshot below, you can see the error rate for both 350.9 and 350.10 versions. This quickly shows that the transactions (or traces) for the payment service running a v350.10 workload are experiencing high error rates, and the v350.9 version is not experiencing the same error rates. This gives the SRE enough information to message the service developer to request that they rollback to the v350.9 stable version.
- The SRE can also use the Tag Spotlight panel to view the RED metrics. Select the version tag from the Tag Spotlight dropdown. This shows the metrics associated with each release, confirming the SRE’s assumptions.

Service Developers investigate and remediate canary deployment release issues
The service developer's role is to monitor the new canary release of the payment service they deployed. As a Service Developer in this scenario, you might receive a message from a SRE notifying you of an issue with the release, or you might identify the problem yourself through seeing it in Splunk Application Performance Monitoring.
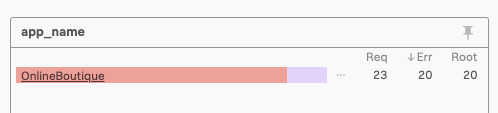
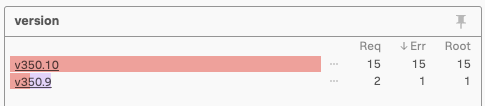
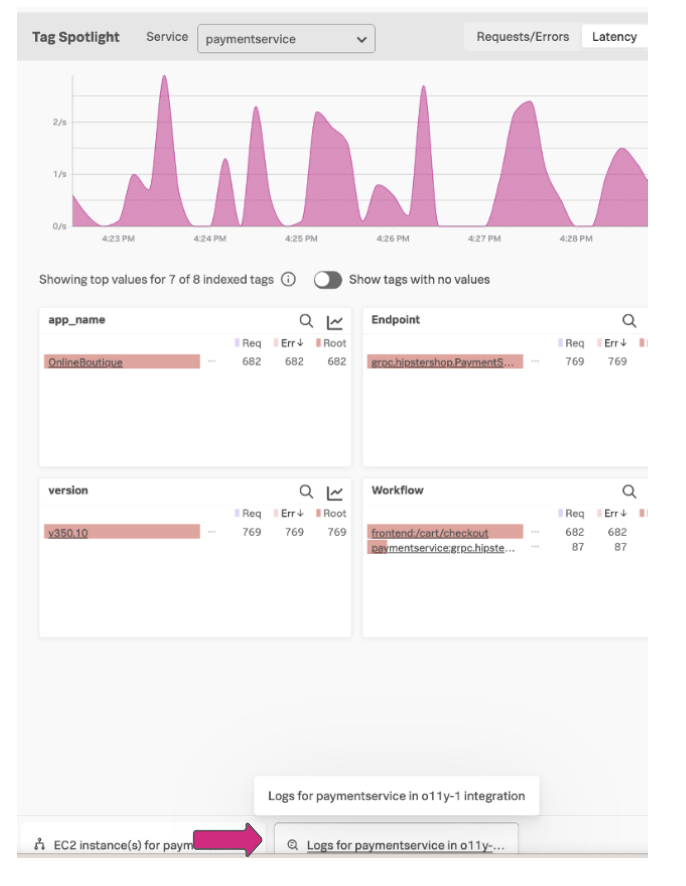
- Navigate to Tag Spotlight and click paymentservice in the Service dropdown. In the bottom-left pane of the screenshot below, you can see that the new version, 350.10, is experiencing a high error rate compared to the 350.9 version.
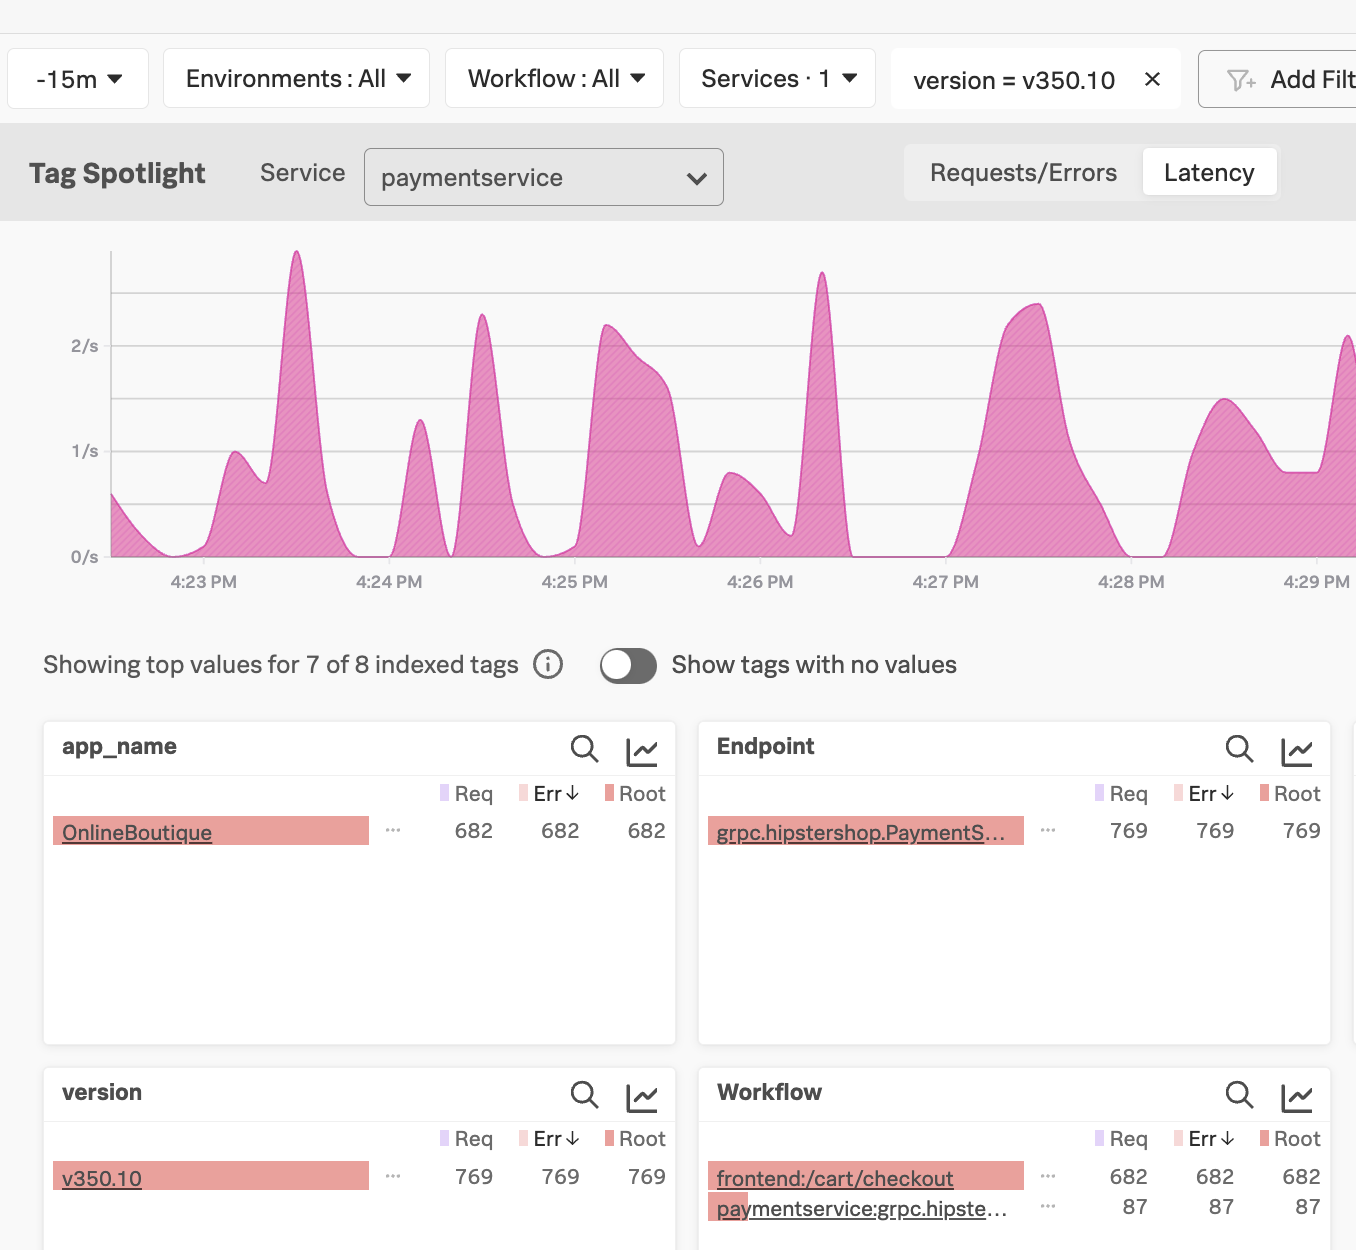
- To determine what applications are impacted by the release, click version 350.10 in the chart and then click Add to filter. The filter is applied and only the application or applications that were impacted are shown. You can also expand the time range to be sure of the scope of the impacted applications. In this example, you can only see a single application is affected, but due to the paymentservice being a shared microservice, there could be many applications impacted. The users of these could be proactively notified of the degradation and the rollback.
- Click Logs for paymentservice at the bottom of the UI to examine the logs from the payment service, which will help you determine root cause.
 Explore the logs and adjust the time frame if needed. After you click on one of the errors, you can see that an invalid API token has been deployed, causing the transactions to fail.
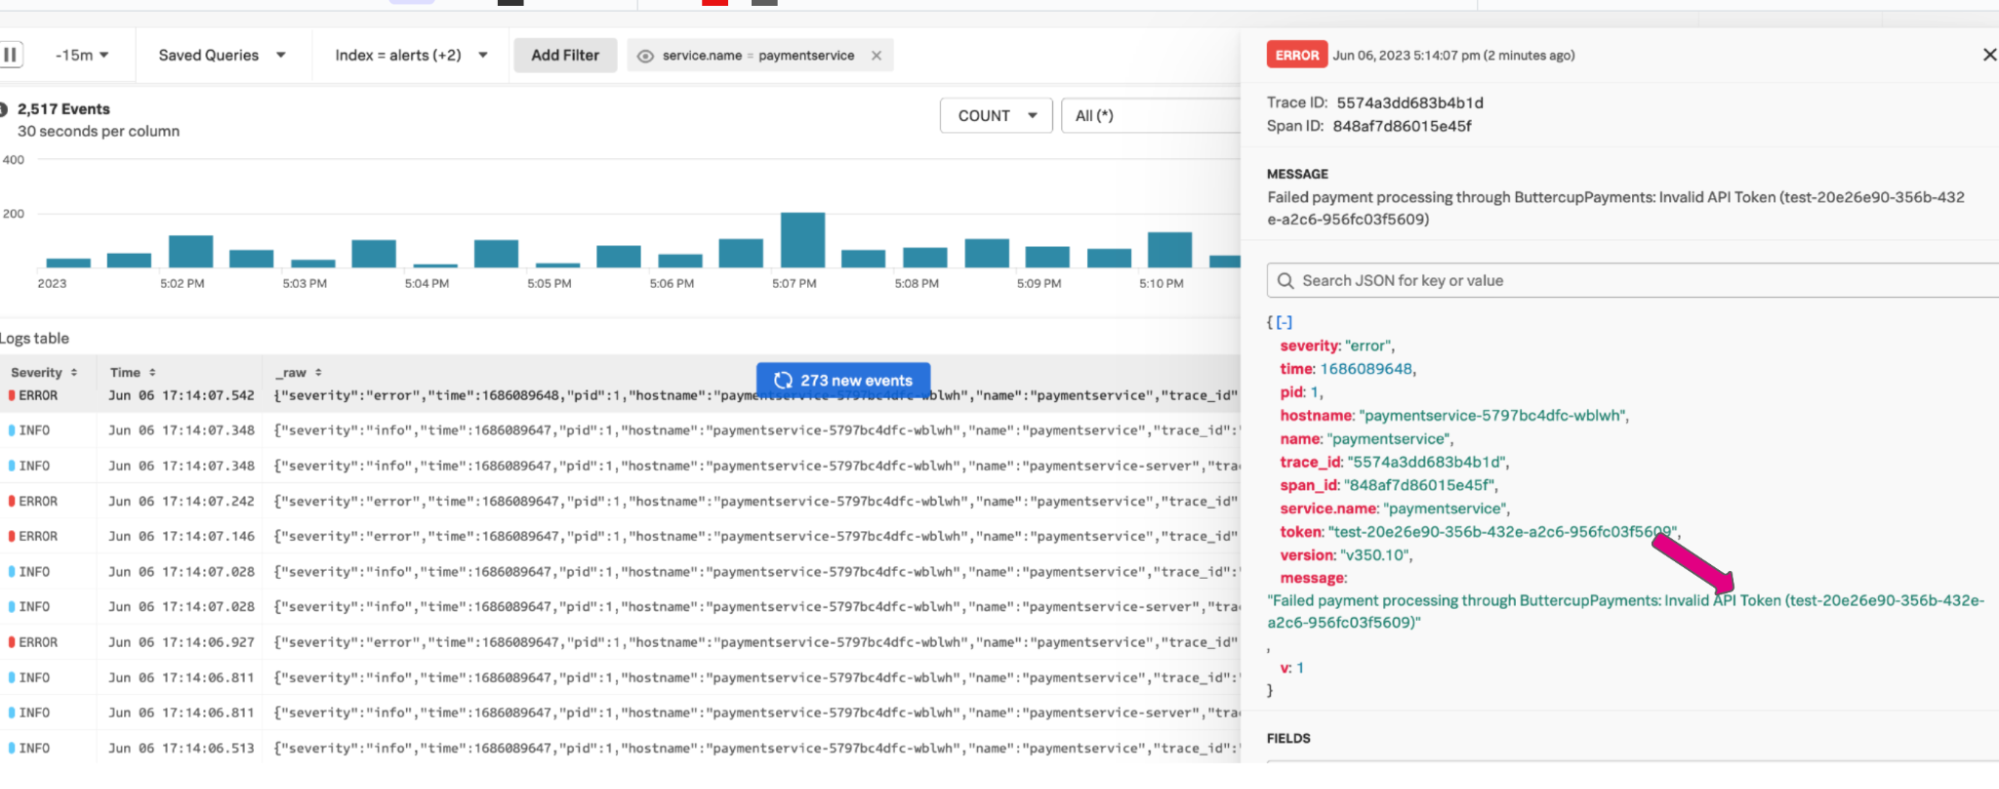
- The service developer determines that the root cause for the degradation of the payment service is the new release which had a bad API token, and completes a rollback to v350.9.
Next steps
Still having trouble? Splunk has many resources available to help get you back on track.
- Splunk Answers: Ask your question to the Splunk Community, which has provided over 50,000 user solutions to date.
- Splunk Customer Support: Contact Splunk to discuss your environment and receive customer support.
- Splunk Observability Training Courses: Comprehensive Splunk training to fully unlock the power of Splunk Observability Cloud.