Monitoring SAP instance service health
Your organization runs several SAP environments, and monitoring them is a top priority for you since they are among some of your most critical business applications. However, monitoring them is not a trivial task - each of your environments is optimized for specific use cases with deep interdependencies. Additionally, these environments are highly dependent upon shared infrastructure components such as storage, compute, or networking.
Traditional SAP monitoring tools, such as Solution Manager, don't provide shared infrastructure correlation capabilities, ways to understand typical environment usage, or the ability to integrate into larger troubleshooting processes via service management platforms. This makes the limited tool set of Solution Manager insufficient for ensuring these critical environments can be effectively monitored.
Your team who manages SAP typically performs destination checks based on their SAP checklists once a day, but with multiple SAP environments and other competing workloads, these endpoint tests are not constantly executed and monitored. More often than not, you detect issues when you're contacted by users who are suffering from broken or partially completed workflows, or when you receive reports of batch jobs being hung or aborted. This isn't ideal, and you need a solution that doesn't rely on customer calls or batch job reports to know when an instance isn't performing well.
Required data
How to use Splunk software for this use case
Splunk Service Intelligence for SAP Solutions has been purpose-built to address these common monitoring shortcomings. It’s an out-of-the-box use case pack that sits on top of Splunk ITSI that you can use to get real time visibility into your SAP stack. It helps you understand the technical health of your stack and also allows you to look at multiple independent stacks across your entire SAP landscape in real time.
This procedure shows how you can address a typical SAP problem scenario in the Splunk platform - in this example, IDoc failures. In this example scenario, your corporate IT department has implemented an infrastructure change using a best guess at assessing the impact of the change. The change is a firewall configuration that blocks a specific port to mitigate an active security threat. An unfortunate side effect of that change is that the new firewall rule also blocks one of the SAP integration destinations for remote function calls (RFCs) to send IDocs (order and invoices) between an enterprise resource planning (ERP) and a customer relationship management (CRM) SAP instance.
- Follow the installation guidance to install Splunk Service Intelligence for SAP Solutions. The installer is mostly automated and allows you to use the built-in services and KPIs within the app.
- Install the PowerConnect for SAP Solutions app, following this install guide. PowerConnect is the brain behind Splunk Service Intelligence for SAP Solutions, and is responsible for unlocking the data from SAP and making it available in Splunk. PowerConnect can access all the data points that are available in Solution Manager or within SAP reports to allow a deeper level of investigative analysis.
- Configure the stacks you want to work with in Splunk ITSI for SAP Solutions by starting the Splunk platform and selecting the Service Intelligence for SAP app. Click through the installer to step 3. In this example, we'll select only ID8 from the list of SIDs.
- In step 4 of the installation, you’ll see a message about a number of missing source types. This is expected and reflects the number of data sources currently integrated into the Splunk platform against the total number possible.
In step 5 of the installation, when the progress bar reaches 100%, you can see the new stack in Splunk ITSI.
- Look at the Splunk ITSI Service Analyzer screen, which opens by default when you launch ITSI. This view can be used and customized to show all the dependencies your operation has, and the KPIs for those services can be used to show trouble spots at-a-glance and quickly establish impact. Use the tree map to search for current hot spots in the environment.
In the example below, you can see the M74 instance has some nodes, shown in orange and yellow, which exceed the normal thresholds for the environment.
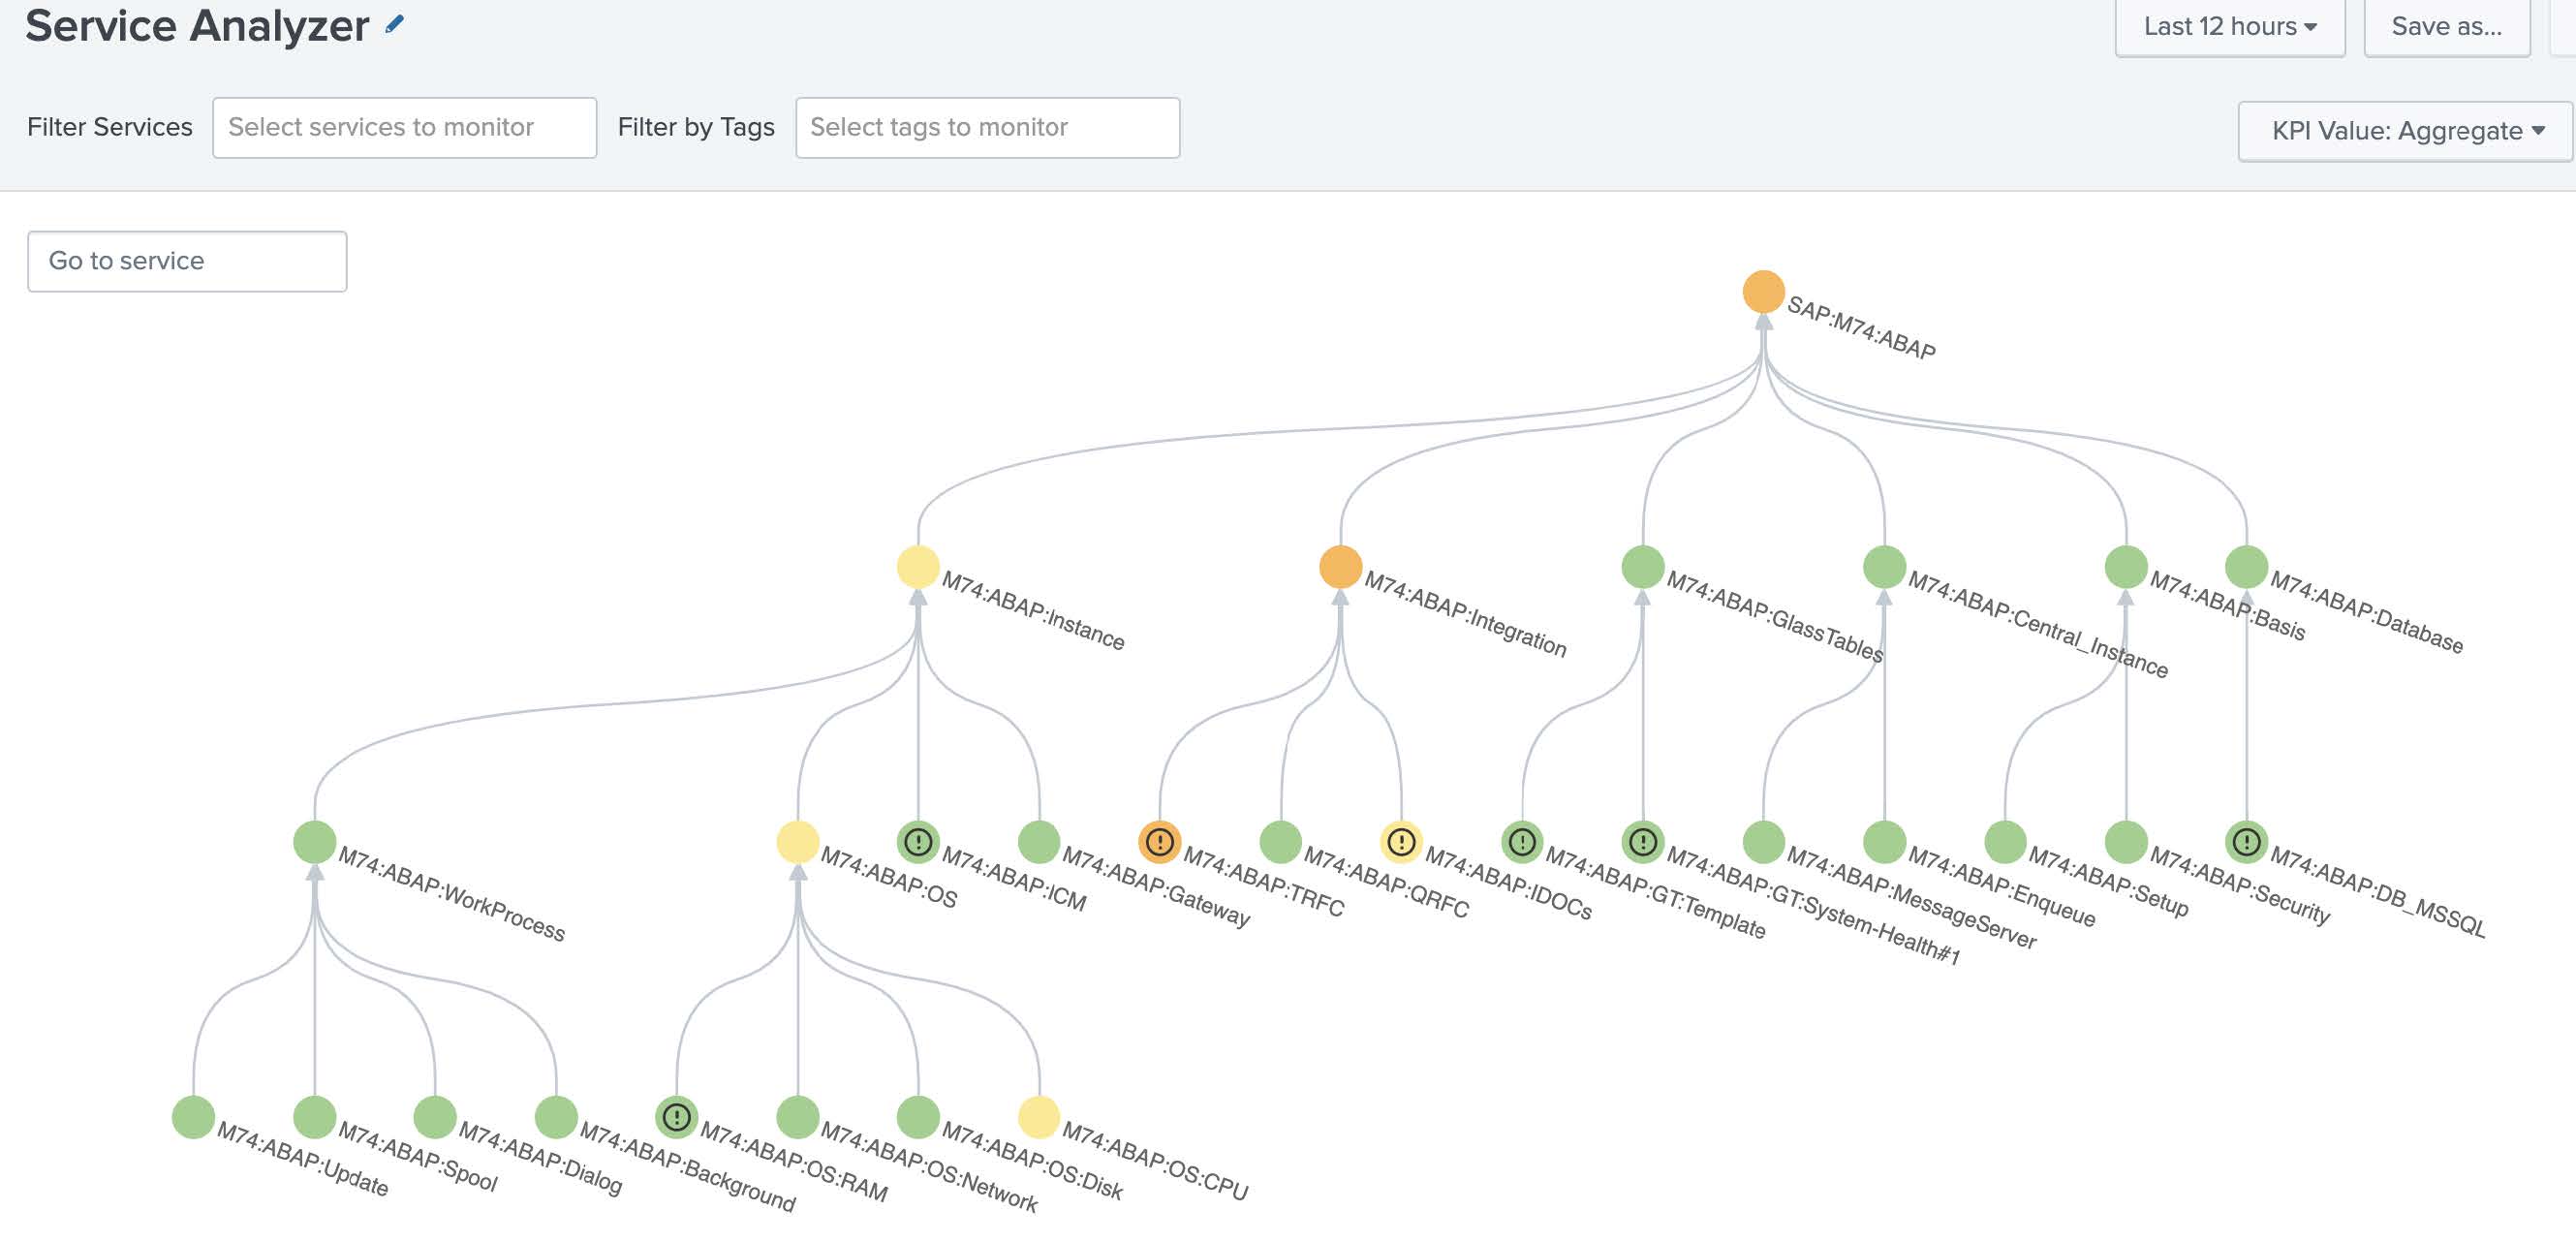
Splunk ITSI can use machine learning to determine what is expected for an environment, determine thresholds appropriately, and adjust them over time. You can use this to set thresholds for an SAP environment so you don’t have to manually tune each KPI to a threshold that makes sense in your environment.
- Start investigating the hot spots and see what KPIs are affecting them..
In this example, we'll click the M74:ABAP:Integration node where we can see that the RFC destinations are failing significantly.
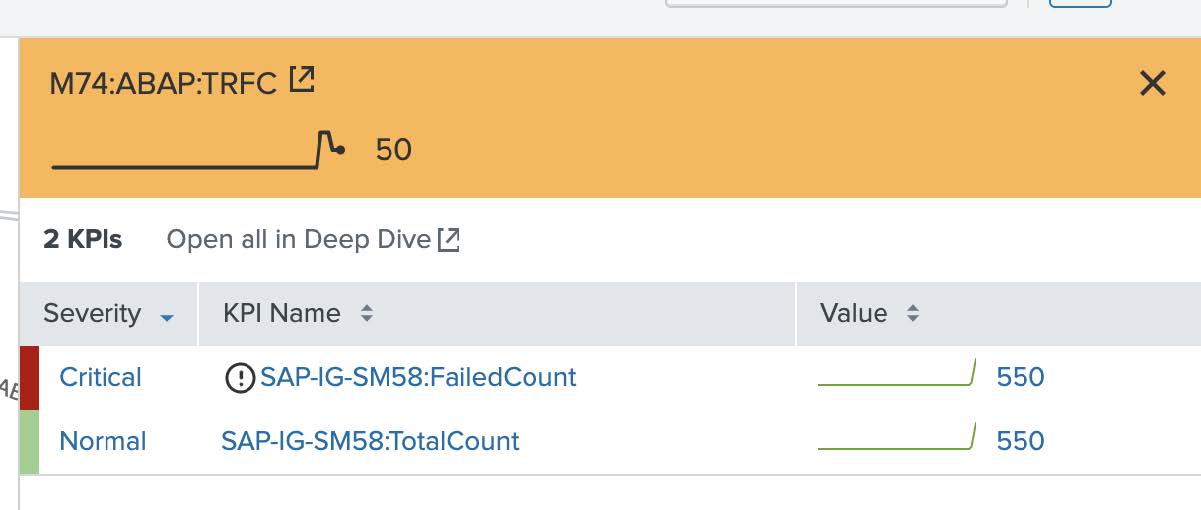
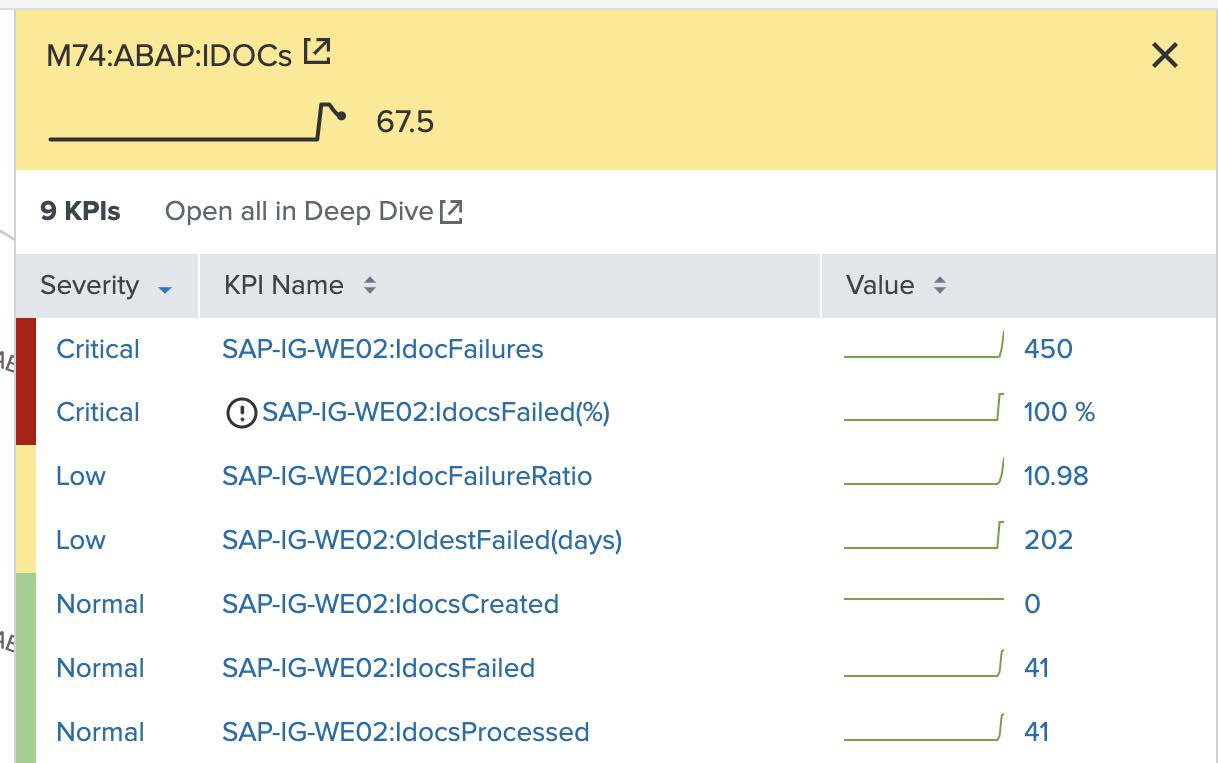
- Move further down the service analyzer trees to see what might be causing the RFC destination failures we saw in the last step.
In this example, we'll click into the M74:ABAP:TRFC and M74:ABAP:IDocS nodes, which all show that failed remote function calls, as well as failed IDocs jobs, are also increasing. This is displayed in real time, giving operations teams faster insights into the current state of the environment without having to pull completely distinct event types or datasets. After queues start backing up, it is only a matter of minutes until users are impacted and outage recovery efforts significantly increase in difficulty.
There are two levels of investigative data available for analysis. In Splunk ITSI, the overall dataset is reduced to a set of KPIs. However, at any point in time, you can drill significantly deeper into these datasets and access another level of detail by launching the PowerConnect best practice Troubleshooting Views.
- To investigate further, from the Splunk ITSI main menu click Dashboards and open the IDoc Status by WE02 Dashboard that runs from the SAP PowerConnect app. Using the filters at the top left of the dashboard, select an appropriate time range and the system in question.
For this example, we will look at the last 60 minutes of data from M74.
Failed IDocs are typically symptoms of a larger root cause, and the teams who manage SAP may not have visibility into shared infrastructure data to speed up their investigation. For example, a failed destination check could be caused by an aborted job, an endpoint that stopped accepting new connections, an unstable network path, a blocked firewall port, or a number of other potential causes. With visibility into the health of shared infrastructure components, the investigation can move faster. Even if the SAP team needs to call the corporate NOC or escalate through a Service Management system, the details provided about the shared infrastructure will help to prioritize the business impact correctly for the network team as well as helping them to speed up the investigation.
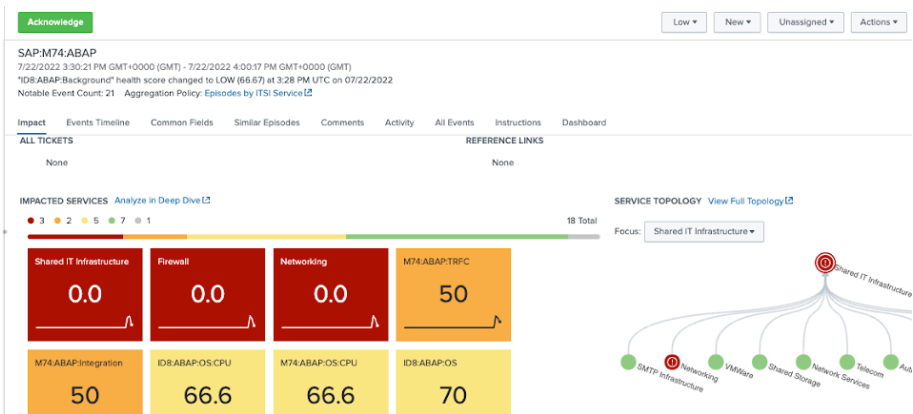
- From the Splunk ITSI main menu, click on Episode Review, and click on an episode. Use the Actions button to acknowledge events, re-prioritize them, or change their lifecycle status. You can also act on them by triggering automated, semi-automated, or manual recovery actions or initiating deeper and broader investigations. Rather than dealing with individual alerts or using simple deduplication, Splunk ITSI clusters alerts together intelligently, substantially reducing MTTR and providing relevant information at-a-glance like open tickets, relevant runbooks, and a holistic impact view.
In this example, you can see that the outage on the M74 ABAP system affecting TRFC, IDocs, and the ABAP Integration tier is also visible on the shared infrastructure - specifically, the networking and the firewall tier.
- Look at the Events Timeline tab and sort for Root Cause Analysis.
In this example, the first event came from the shared IT infrastructure layer and then the firewall status degraded.
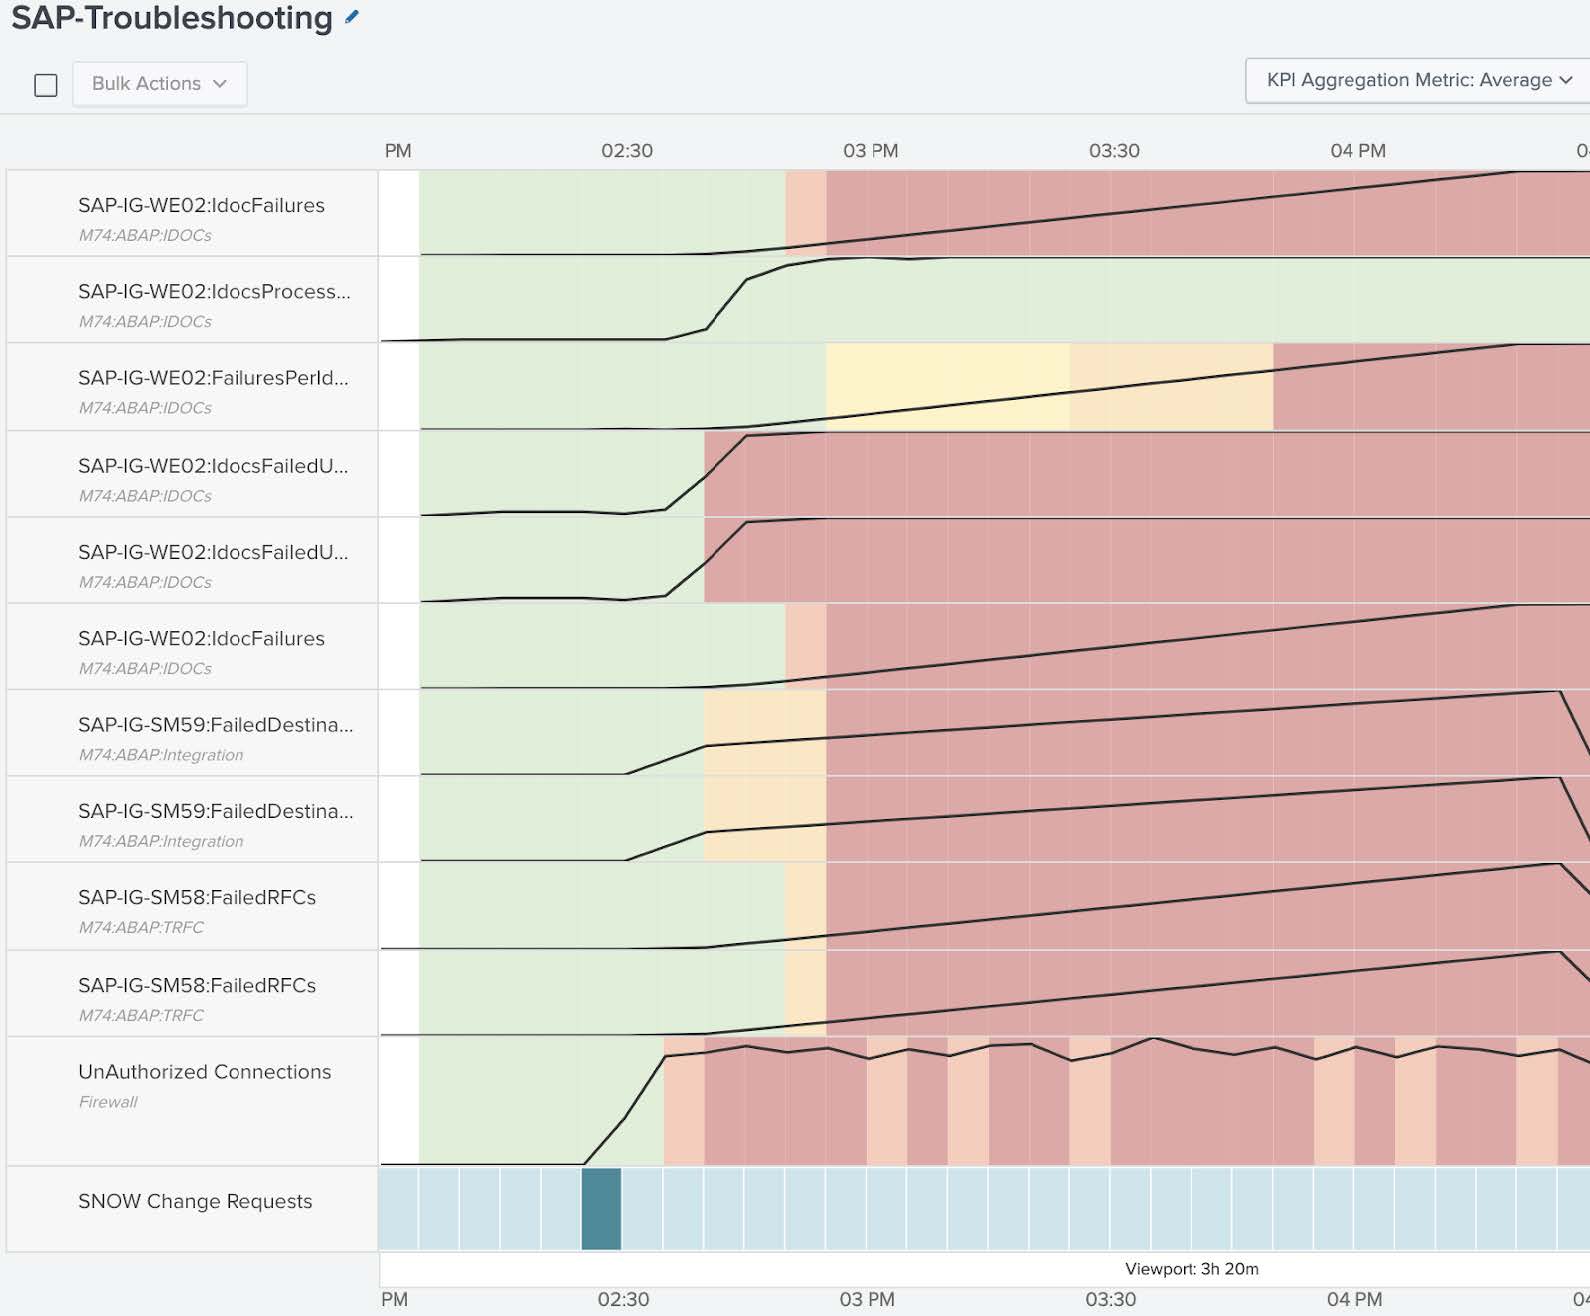
- From the Splunk ITSI main menu, click on Deep Dives, then click the SAP-Troubleshooting Deep Dive and set an appropriate time range. In the Deep Dive view you can visually review the state of the KPIs over time.
In the example below, you can see the IDoc failures - initially low, but eventually increasing. You can see similar behavior for IDoc failures per IDoc. By looking at this information side-by-side with Failed Destinations, it is clear that before the IDocs degraded, the Failed Destinations degraded, and Failed Remote Function Calls came next. Combining that insight with what you saw in Episode Review, which suggested an issue with the shared infrastructure, you can see that these unauthorized connections seem to precede the failed Destinations. Based on that, you could infer that there may be a firewall that is causing all these issues in the environment.
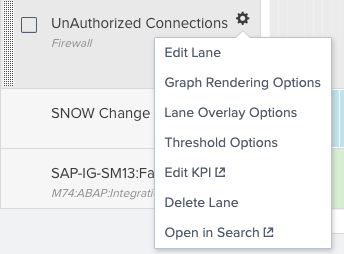
- From the Unauthorized Connections lane click the Settings cog, then Lane Overlay Options, and enable entity overlays. This takes you from an aggregated view to a specific firewall view. Looking at the specific firewall entities you can see that the bizapps-01 firewall seems to have serious activity of unauthorized connections. You can use that information to re-order the deep dive with this new data point by rearranging the lanes to highlight the order of degradation.
- You can then correlate this information with the corporate change request system to determine if there have been any firewall changes that got recently implemented. Click on a dark bar in the SNOW Change Requests lane to see the raw data. By looking at these ServiceNow change requests you can see that there has been a firewall change that was recently implemented. That firewall change was an update to the access control list, and this seems to be the cause of the problem.

- You now have enough information to open an incident in an incident management system, which you can do from Episode Review in the Splunk ITSI main menu. This will help the corporate operations center to accelerate their side of the investigation, since many details are already available. Whether you use ServiceNow, Jira, Cherwell or BMC Remedy, you can use Splunk ITSI to create new incidents without having to swivel between tools. Splunk ITSI can even synchronize major data elements like the status or the priority of the incident. As this firewall incident moves through its lifecycle, changes status and eventually gets resolved, these activities also get reflected in the episode.


Next steps
These resources might help you understand and implement this guidance: