Troubleshooting database performance
The applications you monitor in Splunk Infrastructure Monitoring use databases. Those databases are monitored by detectors that trigger alerts when the databases negatively impact application performance, availability, or reliability. As a CloudOps engineer, site reliability engineer, service developer, or database administrator, when you receive an alert, you need to quickly navigate to Splunk Application Performance Monitoring to determine what services are contributing to infrastructure high resource usage or a performance issue.
As part of DevOps process improvement strategy, you might also be interested in answering the following questions:
- How can we correlate our database performance monitoring with application performance monitoring so when a database incident occurs, the impact to the services can quickly be visualized in the context of a service map and transactions being impacted?
- How can we break down the operational silos and enrich the collaboration between the infrastructure and application teams as part of continuous process improvement?
Solution
You can resolve this scenario with Splunk Application Performance Monitoring’s Database Query Performance capability.
Your company’s leadership wants a proactive operational workflow that starts with a database instance issue such as high CPU consumption or missing cache rate on a database server and having the ability to quickly correlate the applications being impacted and potentially the source of the issue such as a bad database query.
Your company has engineered the use of Redis enterprise clusters for global caching services in support of their microservice architecture and application development framework. Operations leadership wants to assure their tier one application portfolio, including your company's flagship sales portal application, has no observable blind spots as it relates to the new content caching database architecture.
Overall, your improvement goals are:
- Improve the ability of a CloudOps engineer, SRE or DBA to quickly identify and correlate database performance with application transactional performance and impact.
- Improve the DevOps process collaboration between database operations teams and the application SREs, reducing the number of war rooms required.
- Improve incident urgency and prioritization quality based upon application importance and impact radius, in short, knowing what to work on first.
- Improve MTTD (Mean Time to Detect) and MTTR (Mean Time to Restore).
Process
Your company’s sales portal consumes a microservice, called cartservice, where a new version has been deployed that targets Redis database caching optimizations. The service development team just introduced the new version as part of the DevOps CI/CD pipeline using their canary deployment methodology.
A Splunk detector has been deployed and has alerted on when there is a sudden increase of the Redis database instance’s CPU utilization (%). You are the CloudOps engineer who receives the notification.
Here is how the detector has been set up. The detector looks at Redis CPU Utilization (%) signal history and alerts when the CPU % changes 20% above the statistical mean or norm.
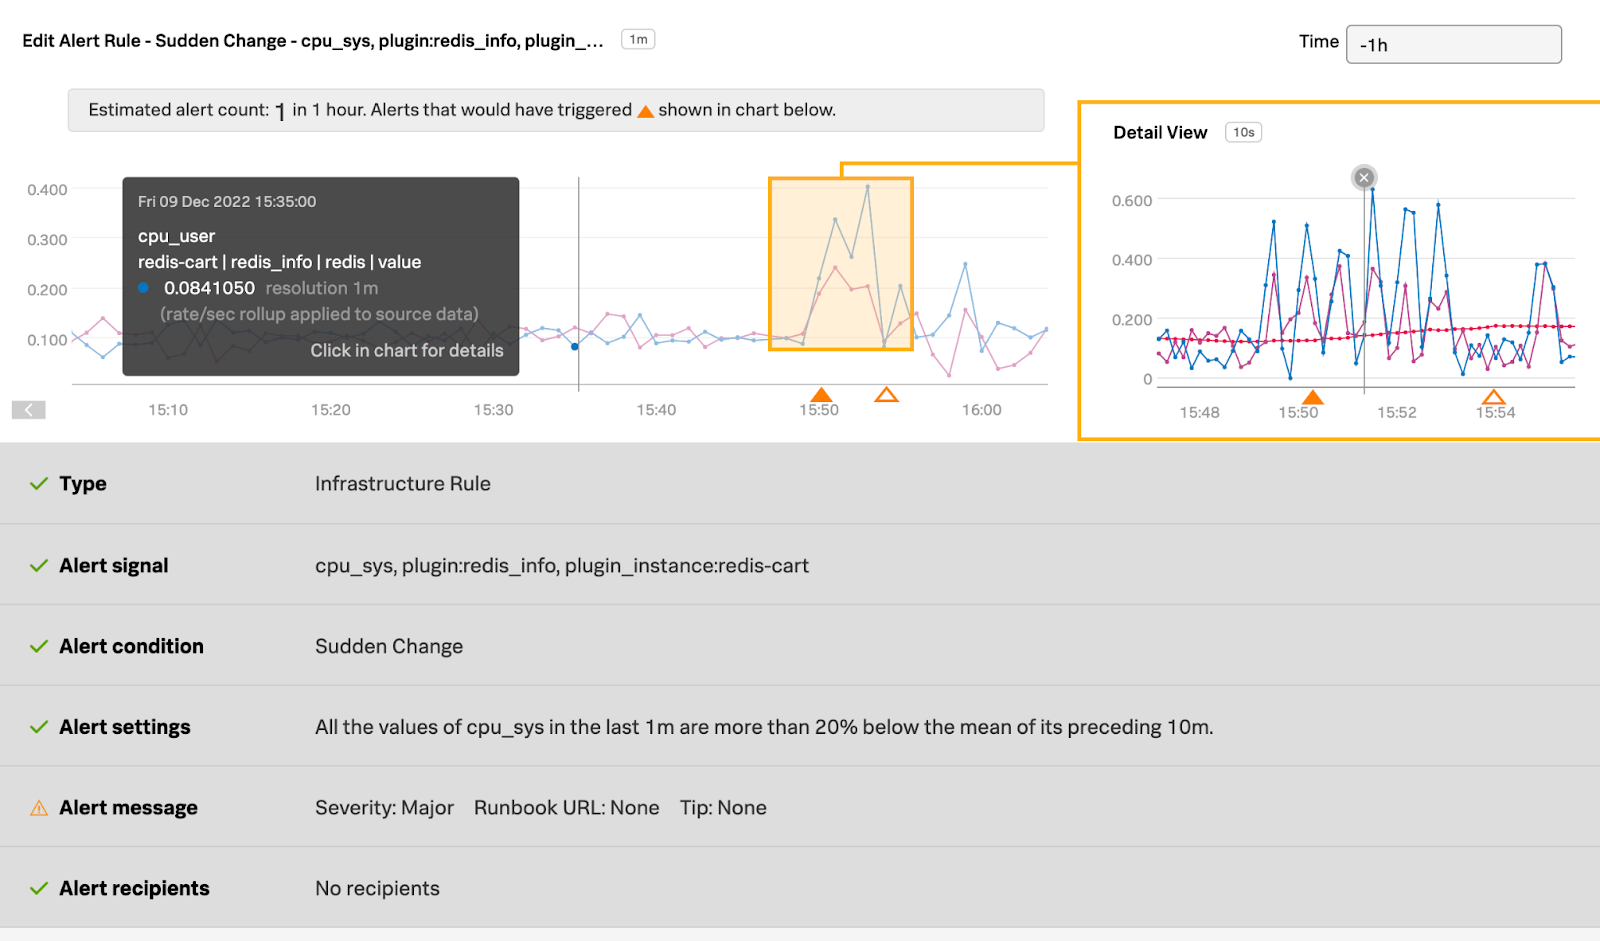
The detector triggers an alert, in this case, when the Redis database instance CPU utilization (%) increases 20% above the statistical mean.
.png?revision=1)
- In Splunk Infrastructure Monitoring, navigate to the Redis database impacted to review the dashboard.
- Here you can see there is a spike in CPU Utilization (%), as well as spikes in Operations/sec and Network Bytes/sec.
.png?revision=1)
- At the bottom of UI, click the Map for redis tab to open the Service Map where you can see the services that are consuming the Redis database instance resources.
- In the Service Map shown below, you can see that the
cartservicemaking database calls to the Redis database is experiencing latency of 2.49s. Click the redis inferred database in the Service Map to access Database Query Performance information.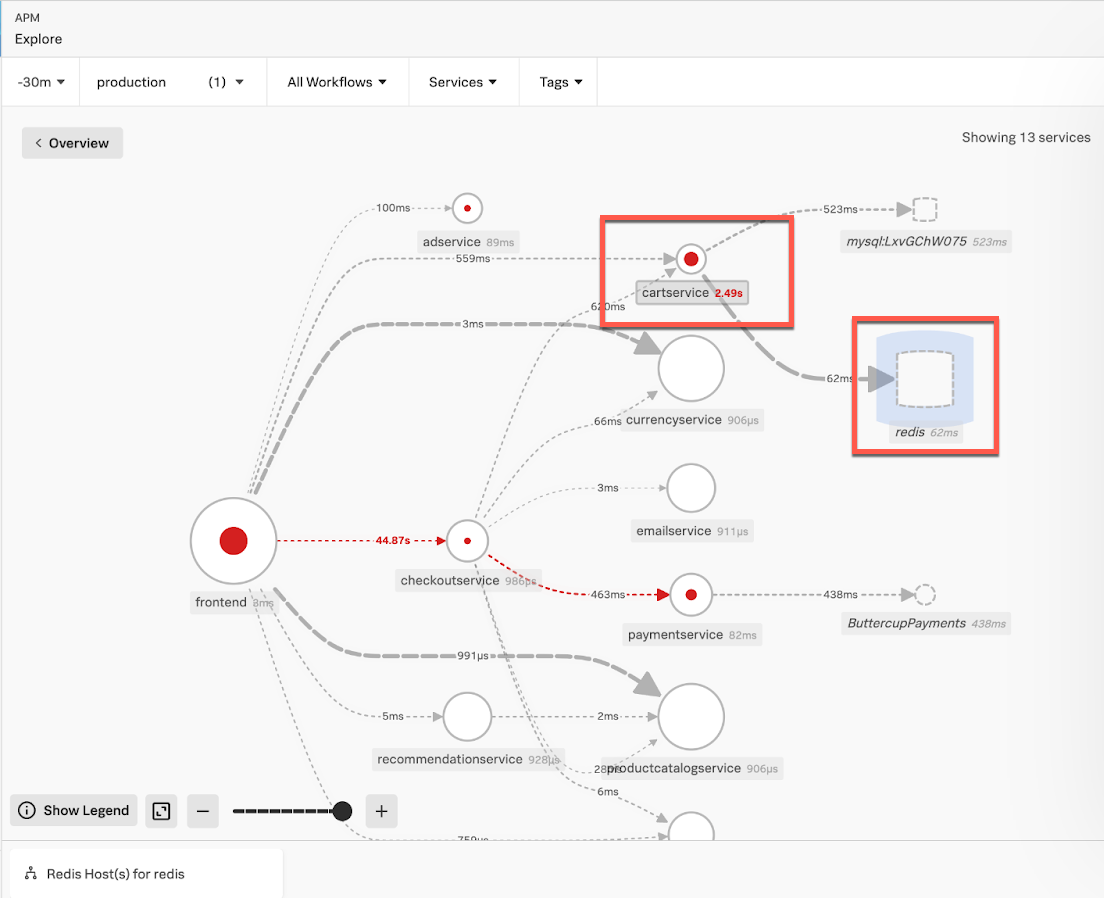
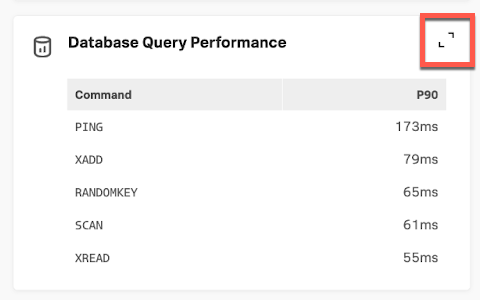
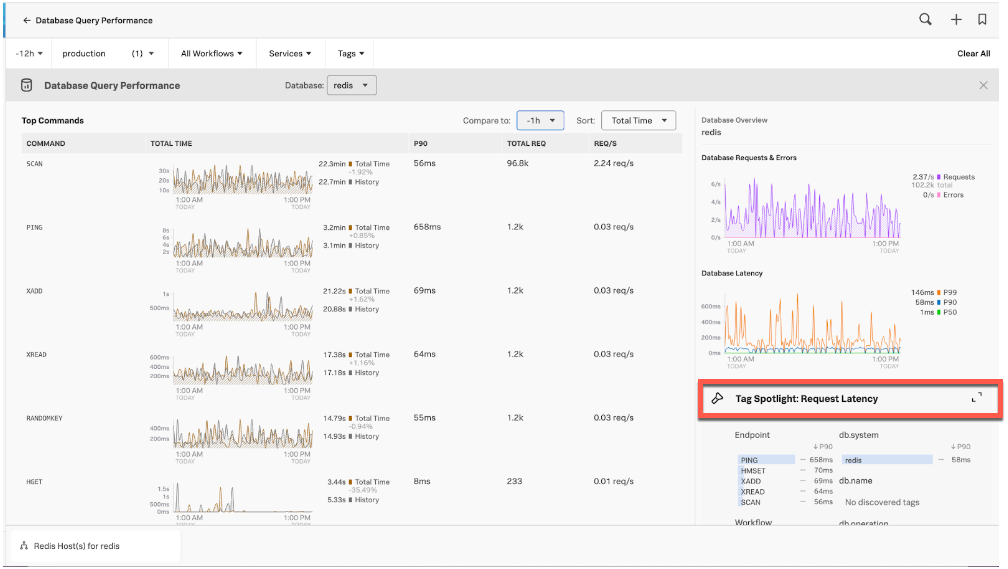
- Latency appears normal for the Redis commands. To drill down deeper, open Database Query Performance by using the expand icon < > at the top-right of this section.
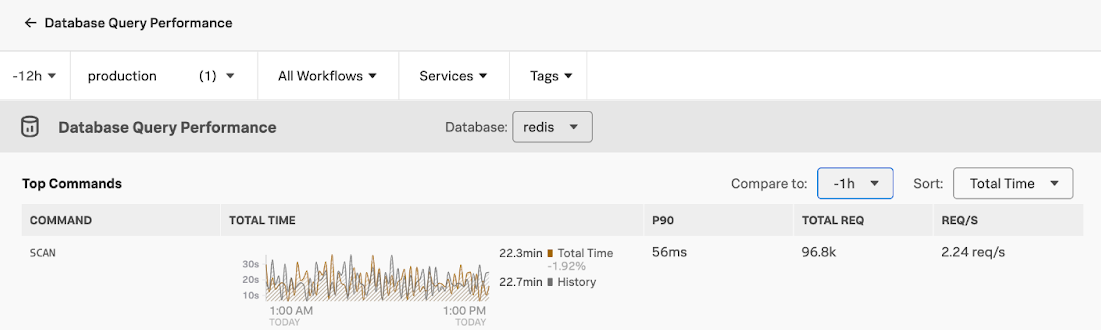
- Here you can see that the amount of SCAN command requests, 96.5k, is unusually high compared to the other commands. The Total Time of 22.3min is also unusually high. From experience, you know that SCANs are not normally used in production services.
- To drill down deeper, open Tag Spotlight: Request Latency by using the expand icon < > at the top-right of this section.
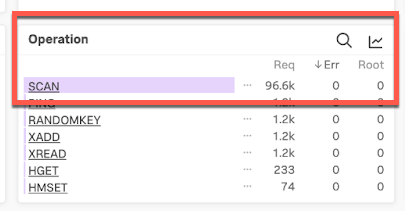
- Looking at the Operation pane in Tag Spotlight you can see the high number of SCAN requests. Double-click SCAN to filter for only SCAN spans.
- On the chart showing the filtered SCAN spans, click a high peak.
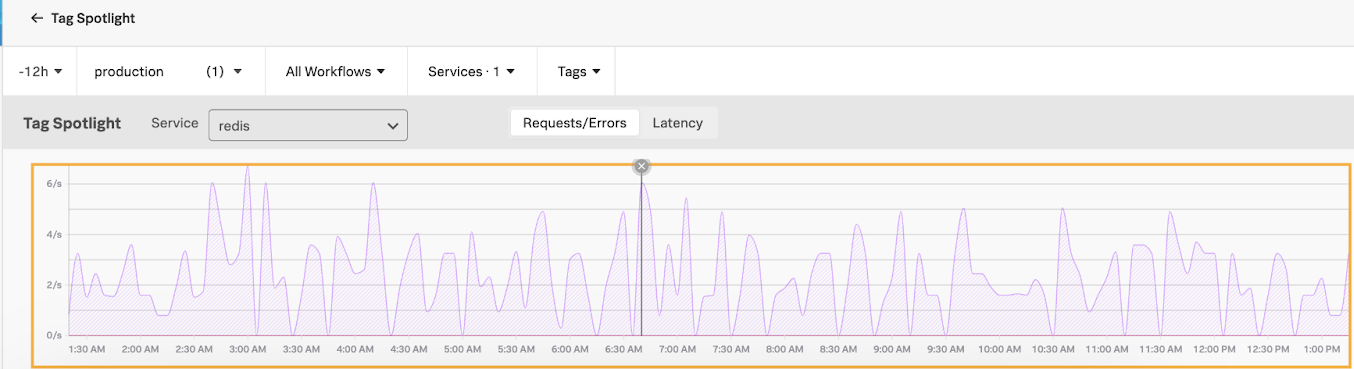
- This brings up a number of traces. Click a trace to examine it further.
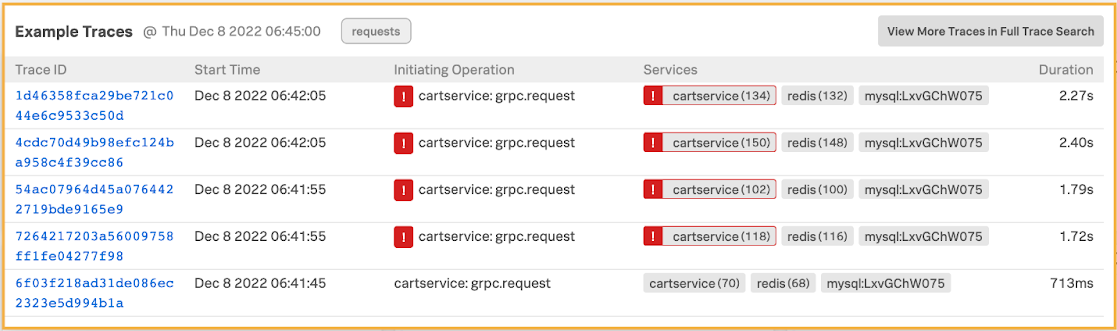
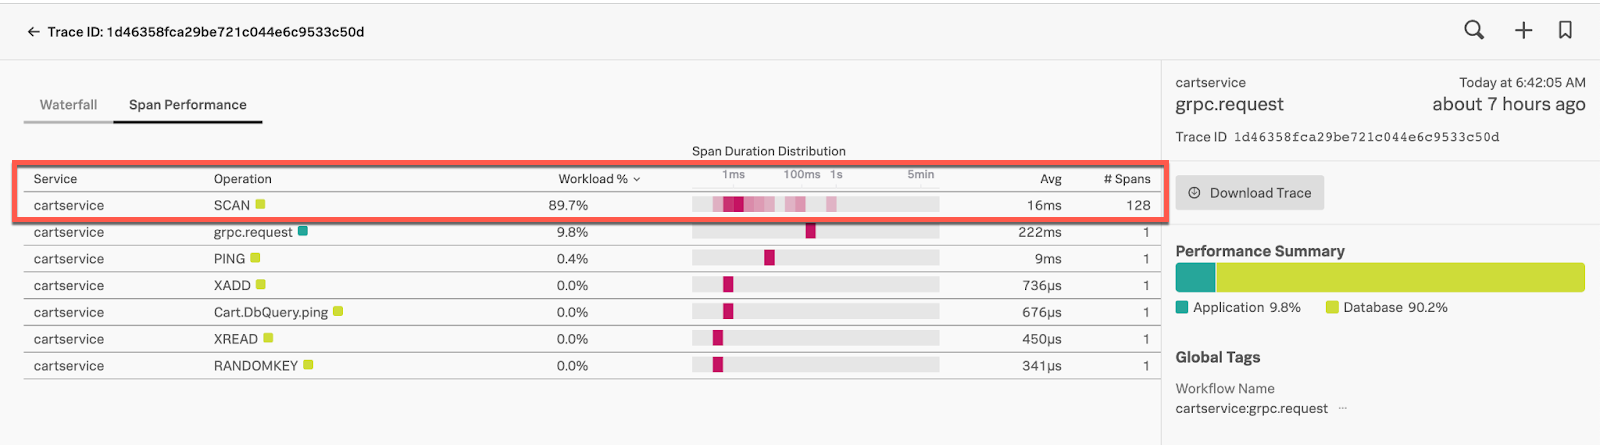
- Click the trace UI’s Span Performance tab. Here you can see 128 SCAN spans for a single trace, and one scan is taking over a second to complete, which is high. The SCAN is also consuming 89.7% of the total workload. Given this information, you conclude this is the probable cause for the Redis database instance CPU Utilization (%), Operations/sec and Network Bytes/sec. You conclude that the SCAN is impacting the database instance resource consumption and potentially the performance.
- At this point, you can notify the
cartservicedevelopment team so they can they perform the rollback of thecartserviceservice version. The team can then identify what led up to this problem - for example, whether the SCAN was introduced for testing and should not have been part of the new build. In an instance like this, the team can remove the SCAN and redeploy, allowing the database instance andcartservicelatency metrics to trend back to normal.
Quick identification of the services that impacted the Redis database instance performance and identification of the root cause helps accelerate MTTI (mean time to identify) and MTTR (mean time to recover), with minimal customer impact.
Next steps
You might also be interested in Troubleshooting a service latency issue related to a database query.
To fully unlock the power of Splunk, we strongly recommend our comprehensive Splunk training. At this stage in your journey, we recommend you explore the Splunk Observability Training Courses.