Gaining better visibility into your third-party APM solutions
You work for an organization that has legacy APM solutions such as AppDynamics, Dynatrace and New Relic. Your business is moving from a monolithic architecture to microservices and accelerating your journey to cloud, with the need to deliver at speed with scale and quality to your customers.
You are finding, however, that visibility into your APM tools is limited to each of these solutions and their interfaces. You want to get all of your data into a single location and normalize it so that you can see all of the results from all the different flows, applications and services across all your APM data. Being able to do this will help you find the needle in a haystack of data with a single click and be able to understand why applications or their underlying infrastructure are not performing. You also need to manage your end user experience, and understand how your customers experience your services or your applications.
Different areas of your organization are developing new requirements for insights and information relating to your third-party APM solutions, for example:
- IT Operations needs to have visibility into the performance and availability of applications and infrastructure to quickly repair or report issues to be remediated, so that services are delivered to all customers without interruption.
- CIOs or CTOs need to ensure full visibility and awareness of key systems and applications, ensuring that business leaders are able to operate the business without interruption or incident.
- Business leaders need to know about end user experience, as well as application and infrastructure performance, so the business can operate effectively and serve customers with speed and efficiency.
Data required
How to use Splunk software for this use case
The Content Pack for Third-party APM helps you to get your key data in from these legacy APM solutions, so you can interact, search and alert on all of your key end user experience, application, and infrastructure performance results. It provides persona-based views for IT Operations, Executive, Business, DevOps, and DevSecOps professionals to deliver them results out of the box.
If you are a customer using IT Essentials Work, some of the features you'll see in the Content Pack for Third-party APM will be more limited than the features available for customers using Splunk ITSI.
The Content Pack provides:
- 3 Glass Tables (Splunk ITSI users only)
- 1 Service Analyzer
- 12 Services
- 30+ KPIs (Key Performance Indicators)
- 1 Entity Type
- 6 Vital Metrics
- 15 Dashboards (Limited dashboards available for IT Essentials Work users)
Glass tables
You can use glass tables to visualize and monitor the interrelationships and dependencies across your IT and business services. Glass tables can create dynamic contextual views of your IT topology or business processes so you can monitor them in real time. You can add metrics like KPIs, ad hoc searches, and service health scores that update in real time against a background that you design. Glass tables also show real-time data generated by KPIs and services.
The Content Pack for Third-party APM includes several preconfigured glass tables you can use to gain insights across the top five industry KPIs. Within the Content Pack, there are three glass tables included:
It's easy for you to clone any glass table then select the services specific to the flow you want, and the process of doing that should take less than 30 minutes.
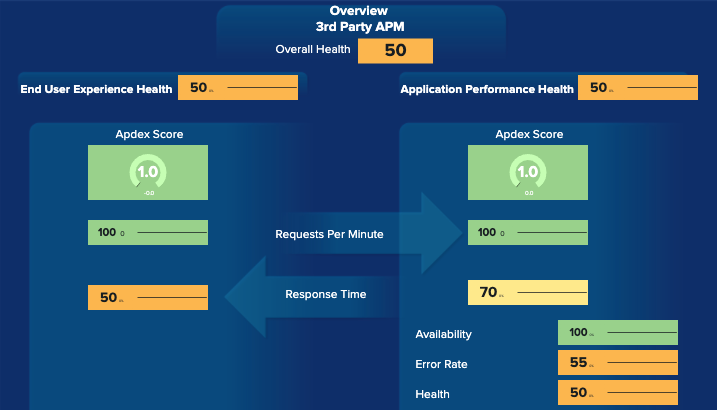
Glass table: 3rd Party APM Overview
The 3rd Party APM Overview glass table delivers rolled-up insights across your APM vendors for a summarized view. Summaries for overall health along with both End User Experience Health and Application Performance Health are included. In addition, six KPIs are included:
- Apdex score to help you assess user satisfaction
- Requests per minute
- Response time
- Availability
- Error rate
- Health
This glass table provides a visual overview of everything going on, across all vendors, and with a single click on any of these results you can access more detail.
In the example below, there is an error rate of 55%, but from this dashboard alone it's not immediately clear what's causing this error rate. To find this information, you can click on it to go to the Service Analyzer.
The Service Analyzer shows the specific services that contribute to the metric seen in the Dashboard. From the Service Analyzer, you can see the individual KPIs that contribute to that error rate. In the example below, Dynatrace is showing a high error rate. Clicking on Dynatrace brings up a list of the services associated with it where you can immediately see that the Checkout service is experiencing a 63.57% error rate.
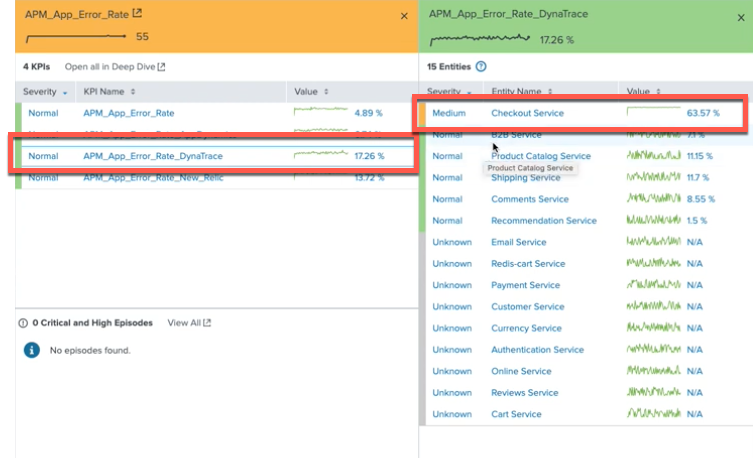
Using the 3rd Party APM Overview Glass Table in this way lets you pinpoint specific issues in only two clicks.
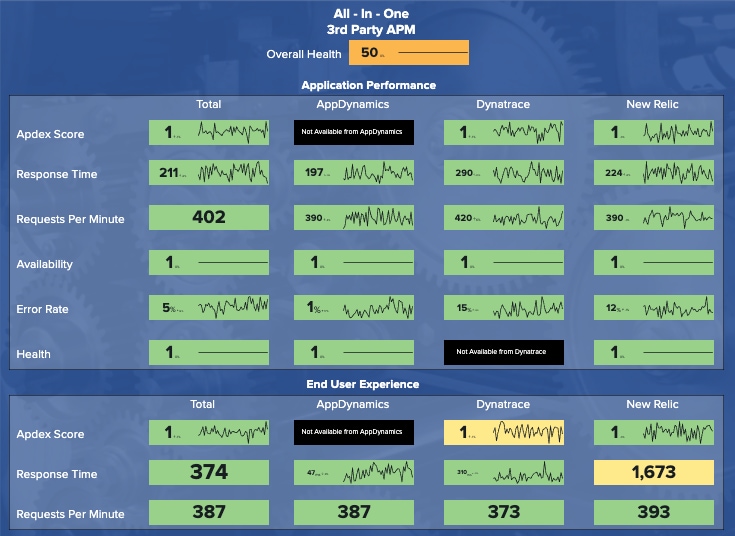
Glass table: 3rd Party APM All-In-One
The All-In-One glass table shows overall health, along with each of the six total KPIs - six for Application Performance, and a subset three in End User Experience. It also shows results summarized by each of the three legacy third-party APM vendors, and a total for each of the KPIs.
With this view, you are able to see the status of each of the KPIs for the overall, application performance, and end user experience areas in a simple and summarized view. Like other glass tables, you can click on any of the results to get more detail.
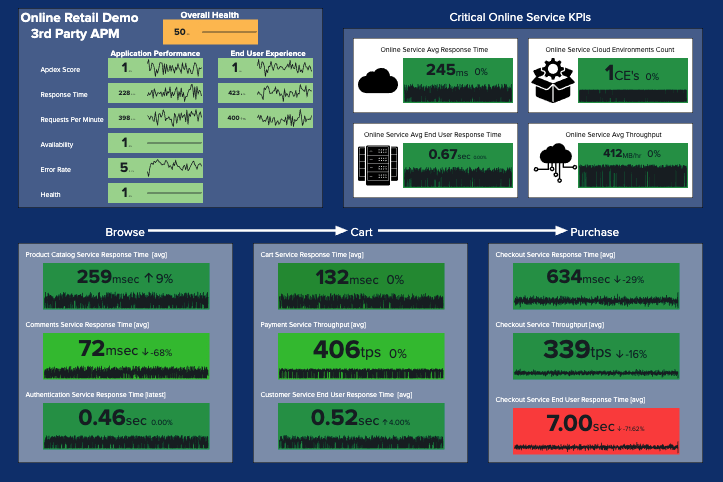
Glass table: 3rd Party APM Online Retail
This glass table gives you an out-of-the-box solution specifically designed for online retail settings. You can use the Global Time Range and Global Refresh Rate menus at the top of the page to filter the results that displays.
The glass table is divided into 5 major sections. The first section shows the same scores as the All-In-One table. In the upper-right are four critical online service KPIs. Lastly, the bottom sections shows a left-to-right workflow of a user moving from browsing, to cart, to purchase. It highlights several of the key services and their KPIs throughout the online retail experience. You can click any of these sections to see more.
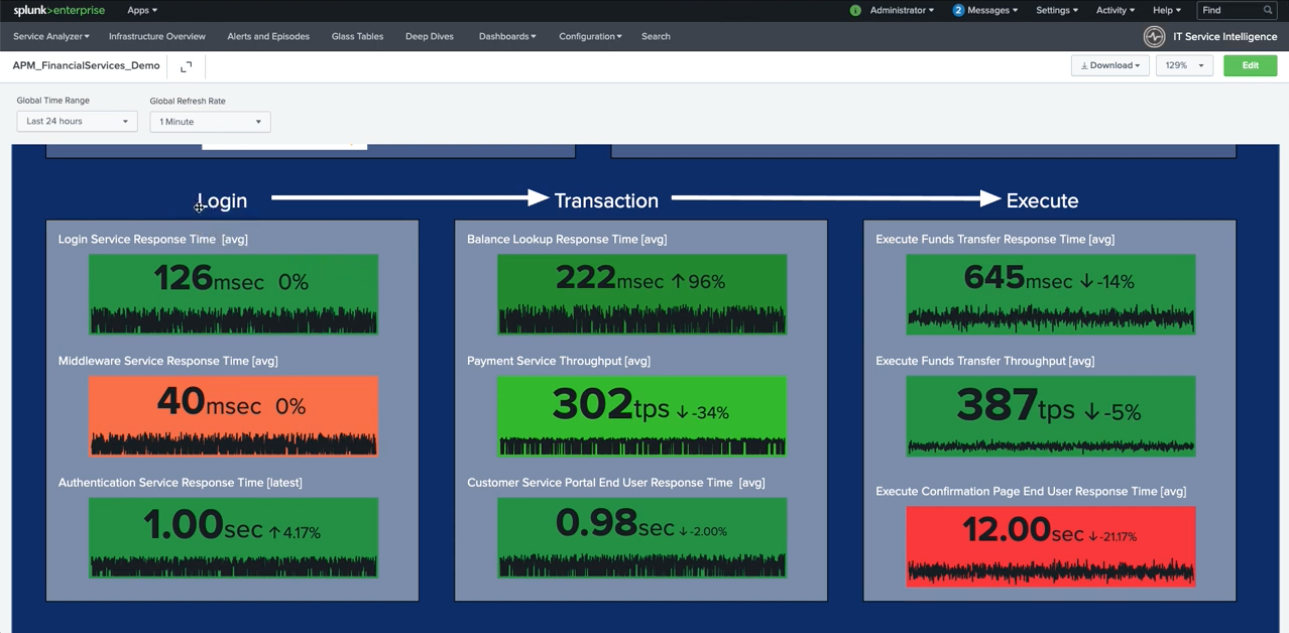
Custom glass table example
It's easy to create new glass tables or clone existing ones, then edit the services and KPIs shown within them, to create glass tables that are relevant to your organization. The example below shows a clone of the retail-focused glass table but updated with metrics applicable to a financial services scenario, with a flow from login to transaction to execution of those transactions. Setting up a new glass table from a clone of the retail-focused glass table can take as little as 30 minutes.
Service Analyzer
The Service Analyzer is the home page for Splunk ITSI and serves as your starting point for monitoring your IT operations, so you can see the health of your IT environment at a glance.
The Service Analyzer provides an overview of Splunk ITSI service health scores and KPI search results that are currently trending at the highest severity levels. Use the Service Analyzer to quickly view the status of IT operations and to identify services and KPIs running outside expected norms. You can click any tile in the Service Analyzer to drill down to the deep dives for further analysis and comparison of search results over time.
How to use the Service Analyzer
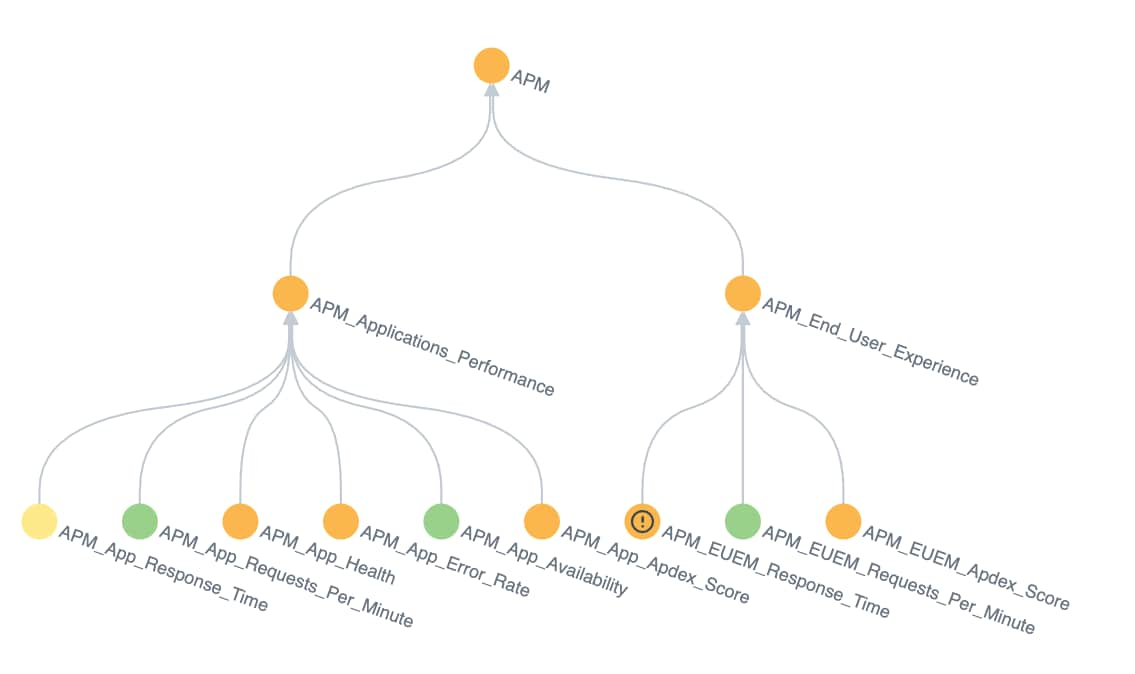
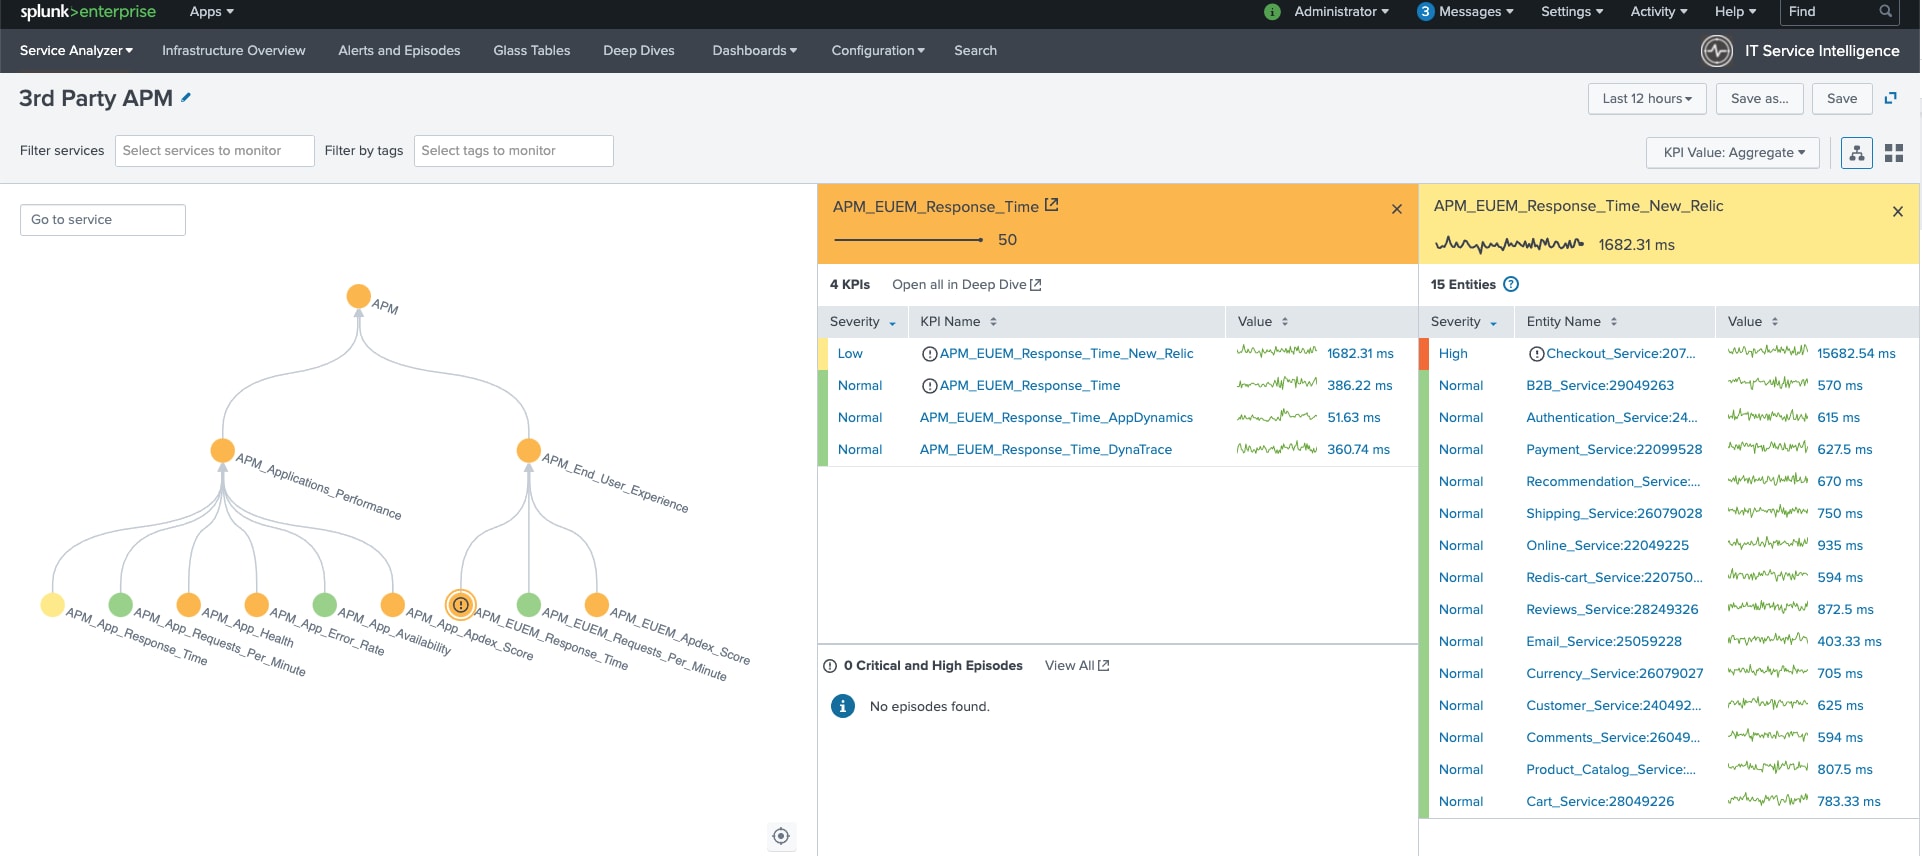
Within the Service Analyzer tree view, as shown in the example below, you can clearly see each of the 12 services and also see how the underlying KPIs are reporting. The third-party APM solution is shown at the top. Underneath that you can see services for application performance, as well as services for end user experience. The colors used indicate the health of each of the underlying services. Under APM_End_User_Experience, for example, you can see APM_EUEM_Response_Time, where EUEM stands for End User Experience Management. This service is shown in orange and with an exclamation mark to indicate that the service is not performing optimally and that a problem of high severity is occurring.
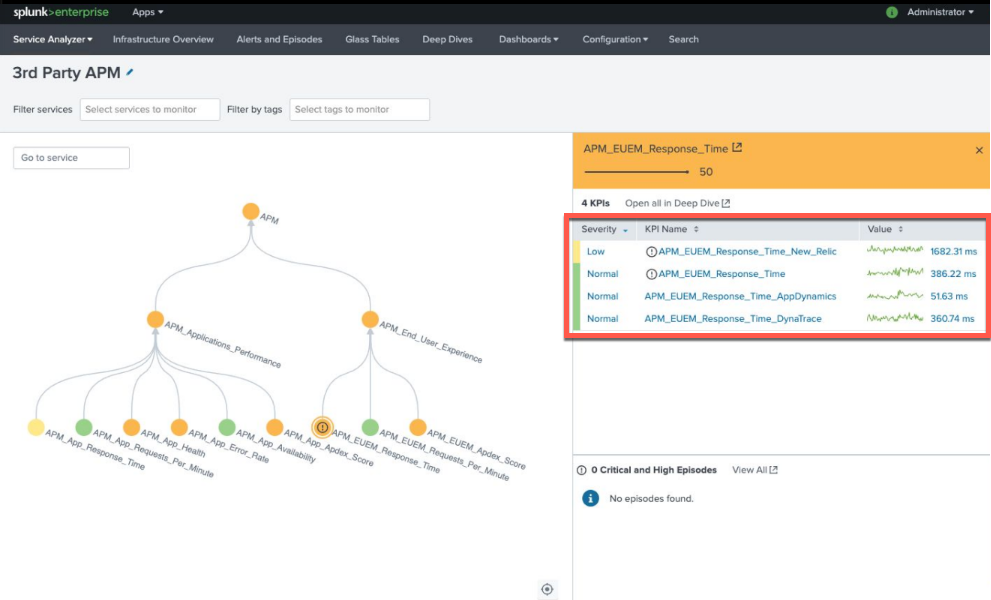
In the example below, clicking into the service shows some normal and some low severity KPIs associated with the service. These are based on thresholds that have been set. The data that these KPIs are drawing from is based on Dynatrace, and AppDynamics as well as New Relic. The KPI marked low here is reporting a 1682 millisecond delay. Since this KPI is associated with the end user experience, this indicates that the end user customer is waiting 1.6 seconds for something.
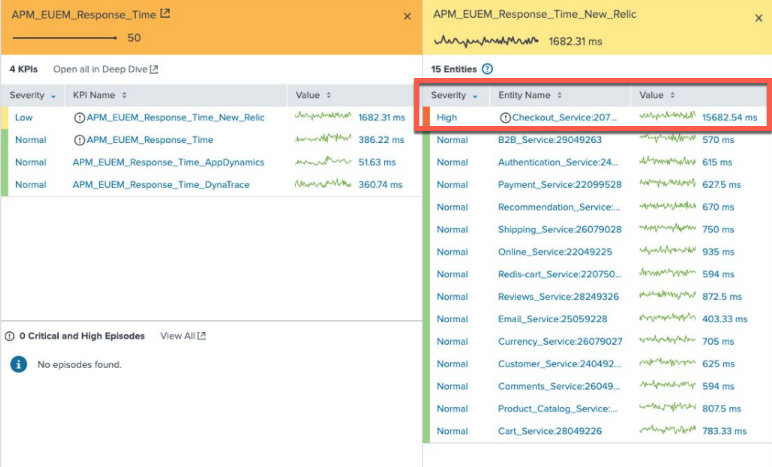
Clicking the low severity KPI brings up detail of the entities associated with the KPI. In the example below, most of the entities are reporting in as normal, but one entity associated with the checkout service is high severity, with an associated 15.6 second wait.
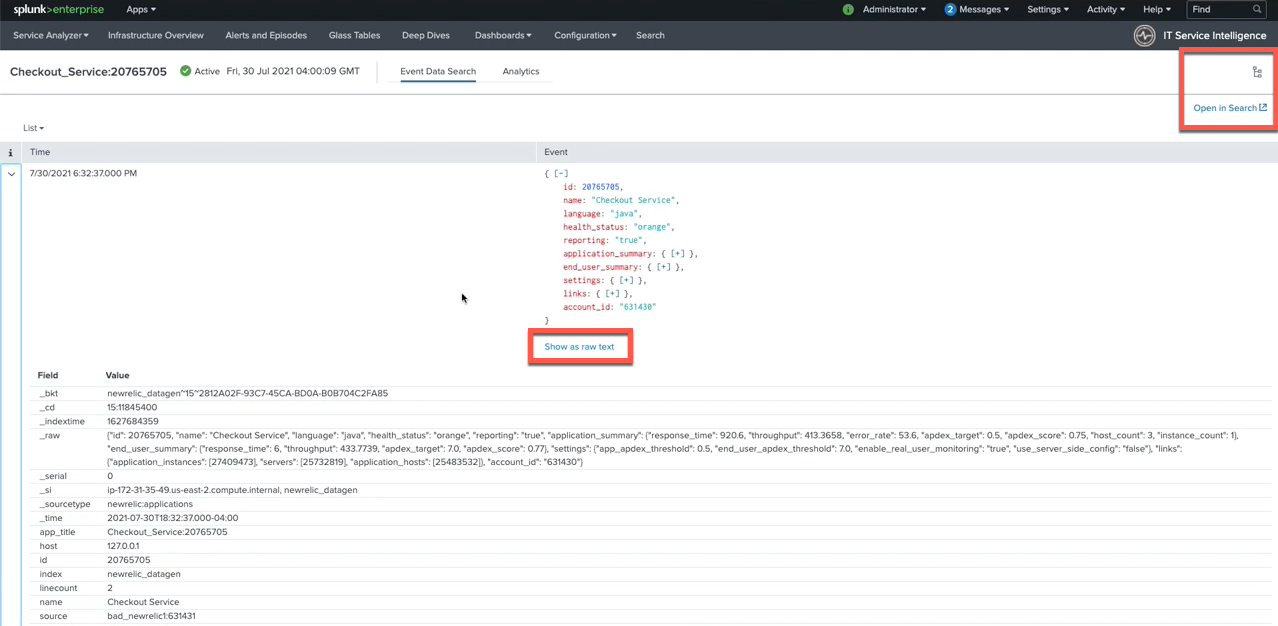
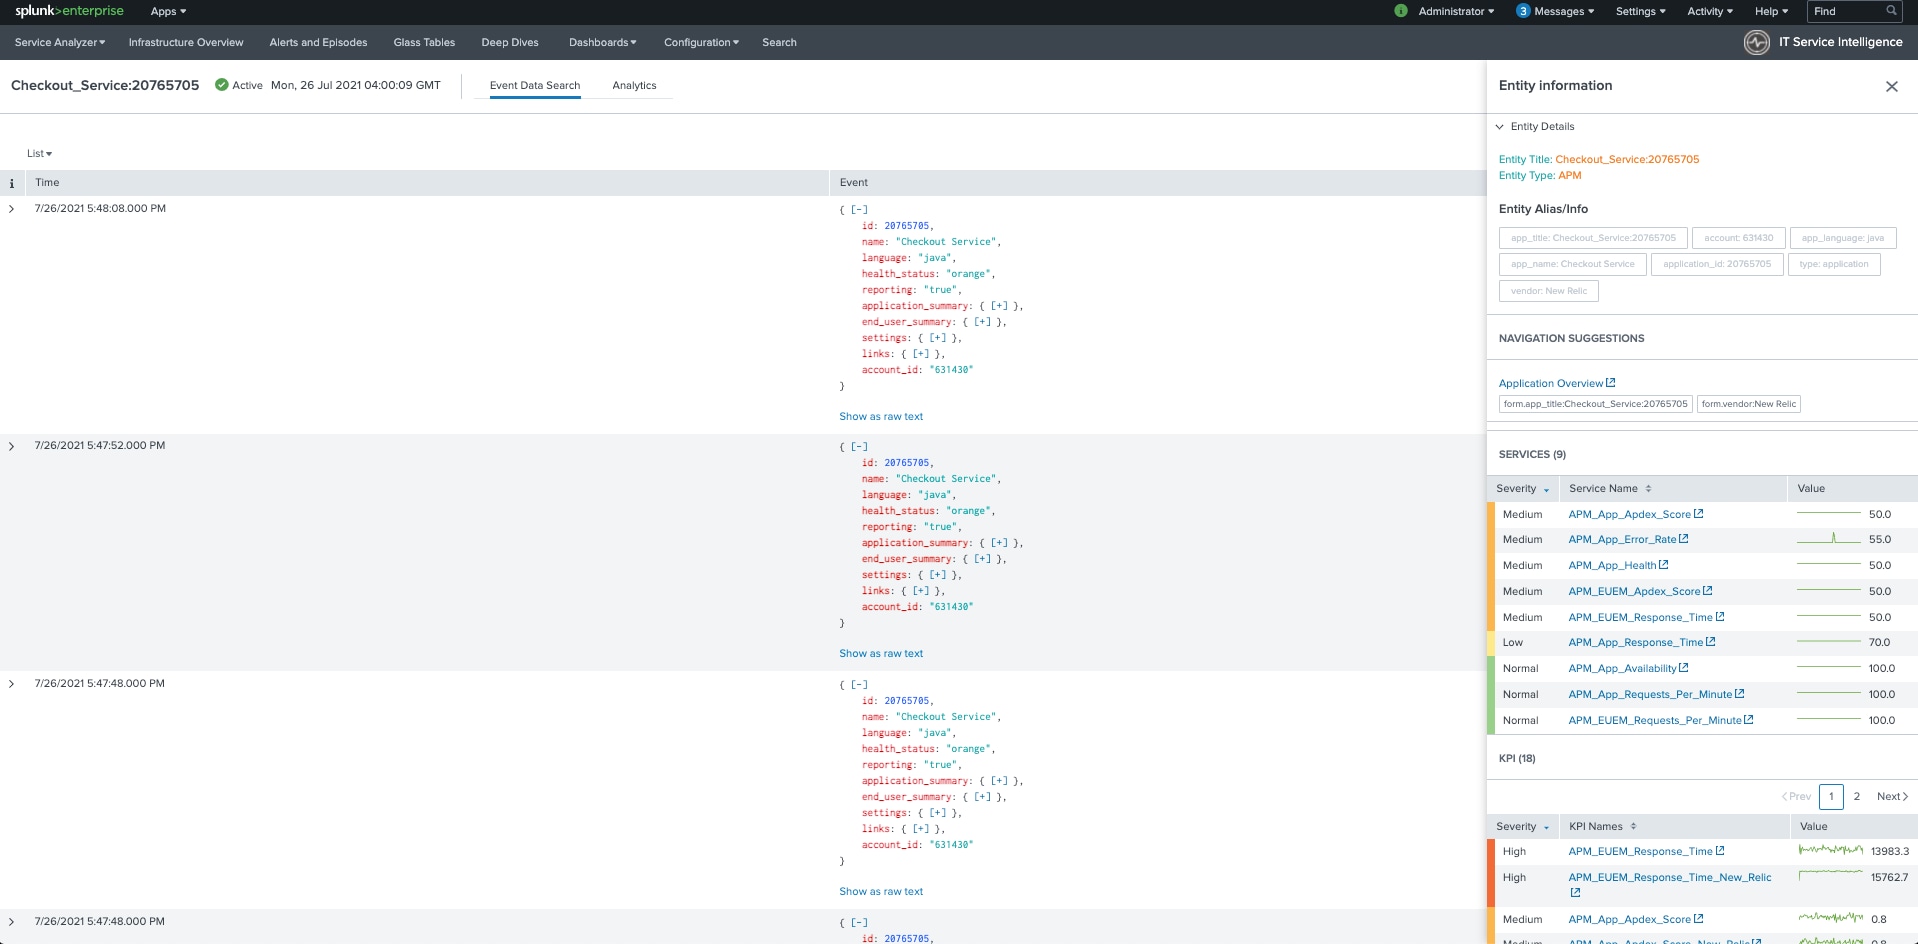
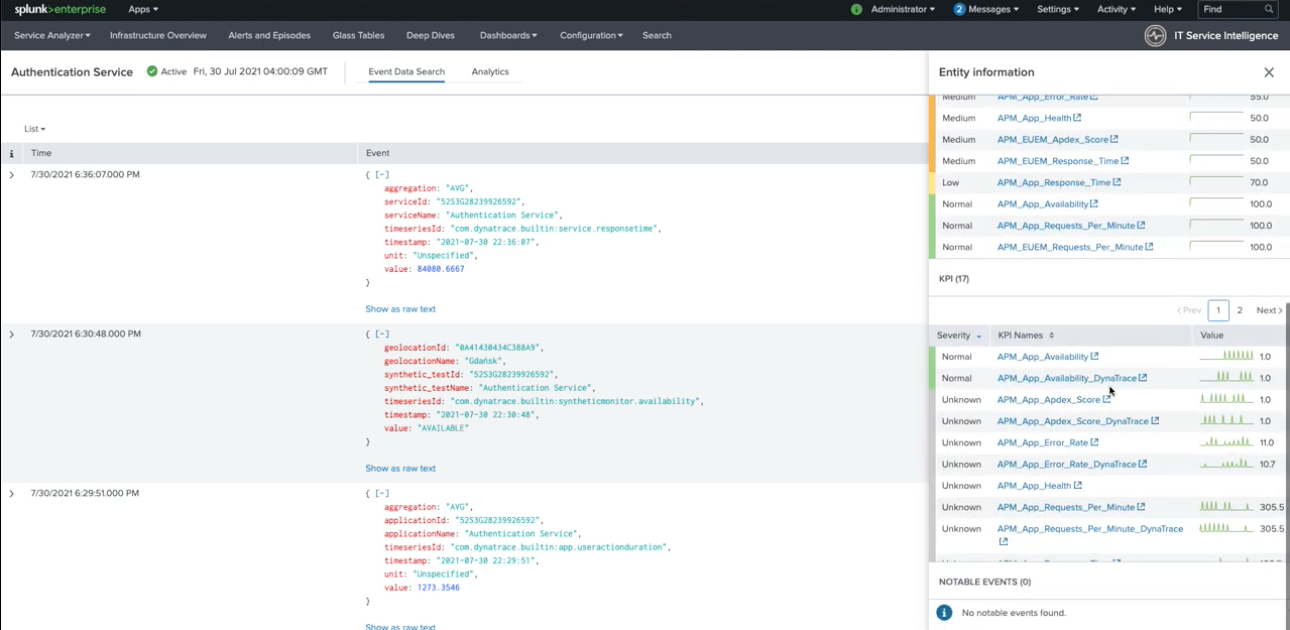
Clicking into the checkout service that's experiencing delays brings you to the Event Data Search so you can investigate further. If you need to access the raw data, you can click Show as raw text to see that. In the top-right corner, you can open the results in search and click the icon above to return further entity information.
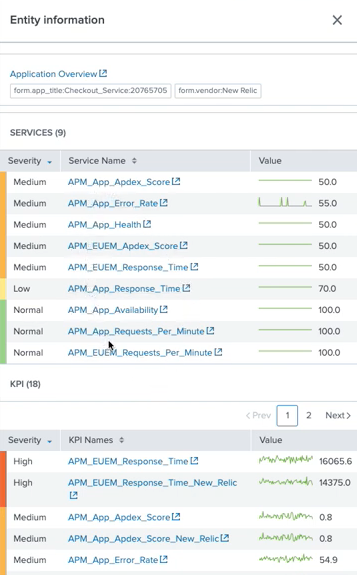
The entity information you can see in the example below is specific to the APM entity type. You can see 18 KPIs associated with the service and all the results associated with those.
Clicking through the Service Analyzer in this way provides you with the overall view you need to understand how your services are performing on average. It also lets you click down into the detail for deep investigation into what factors influence overall service health.
Services
A service is a logical mapping of IT objects that applies to your business goals. Some services might have dependencies on other services. Services contain KPIs make it possible to monitor service health, perform root cause analysis, receive alerts, and ensure that your IT operations are in compliance with business service-level agreements (SLAs).
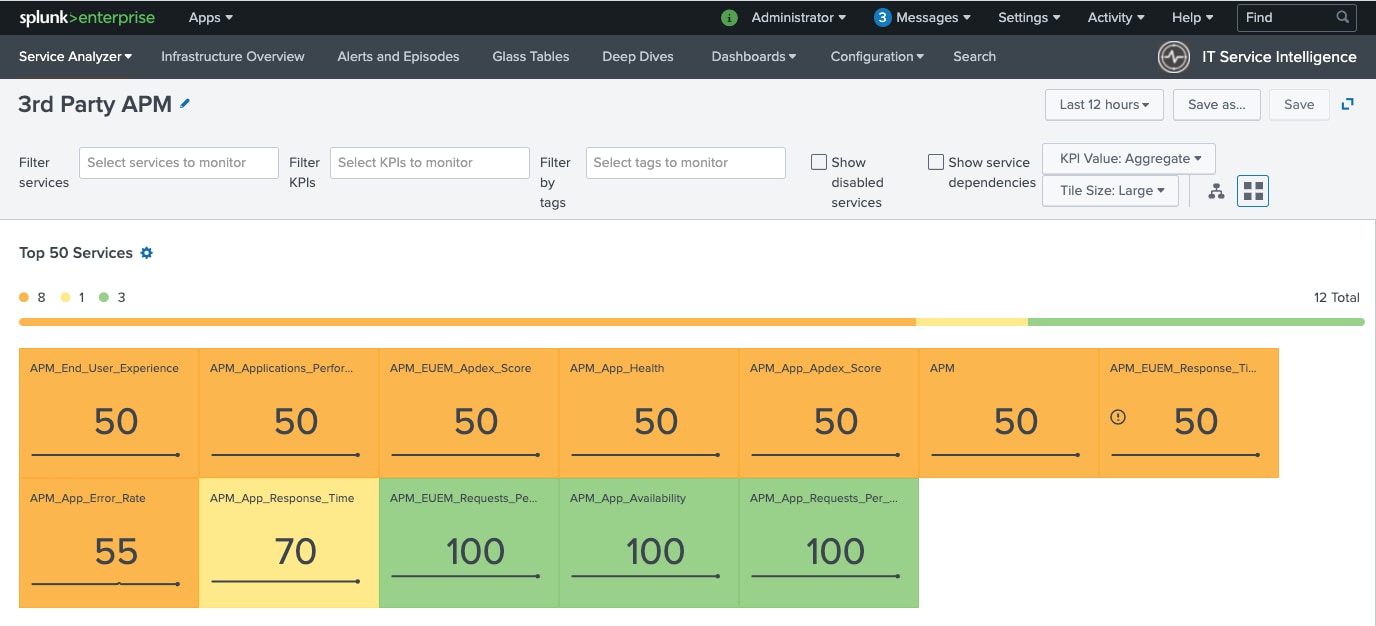
Using the tile view of the Service Analyzer you can get insights across all 12 services, and find out their status for the given time range selected. You can also click into more results for any of these services to see their KPIs and entities.
If you want to view and work with these services or view the Service Templates they have been architected from, you can do this within the Configuration menu in the Splunk ITSI toolbar.
KPIs
A KPI (Key Performance Indicator) is a recurring saved search that returns the value of an IT performance metric, such as CPU load percentage, memory used percentage, or response time. KPIs are used to monitor the health of a service.
You create a KPI within a specific service. It defines everything needed to generate searches to understand the underlying data, including how to access, aggregate, and qualify with thresholds. You can use the search result values to monitor service health, check the status of IT components, and troubleshoot trends that might indicate an issue with your IT systems.
Within the Content Pack for Third-party APM there are 30+ KPIs included, so you have deep insights across your legacy third-party APM vendors. You can easily access results and see the underlying entity that is causing issues.
If you want to view and work with the KPI base searches, you can do this within the Configuration menu in the Splunk ITSI toolbar.
For a full list of services and KPIs, see the KPI reference for the Content Pack for Third-party APM.
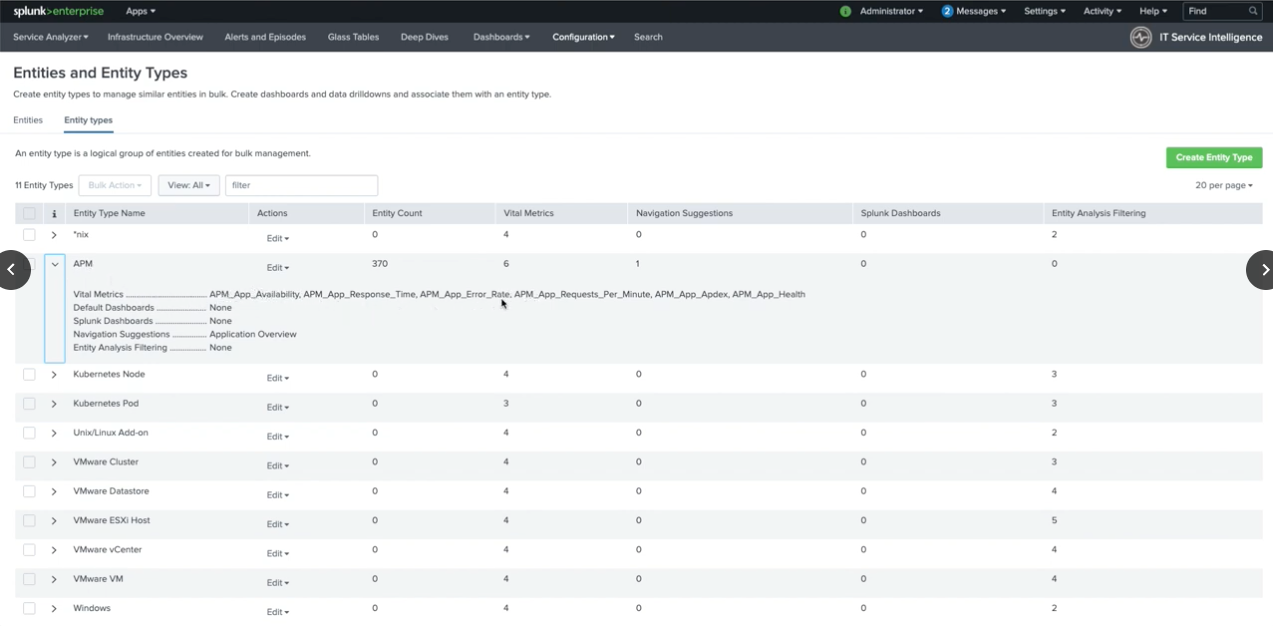
Entity types
The Content Pack for Third-party APM includes a custom entity type. You can use associations to visualize and troubleshoot various entities.
For example, this Content Pack ships with an entity type of APM, which you can use to import your 3rd-party APM services as entities. You can group entities by entity type in the infrastructure overview, so you can visualize key metrics relating to the health of APM entities and services.
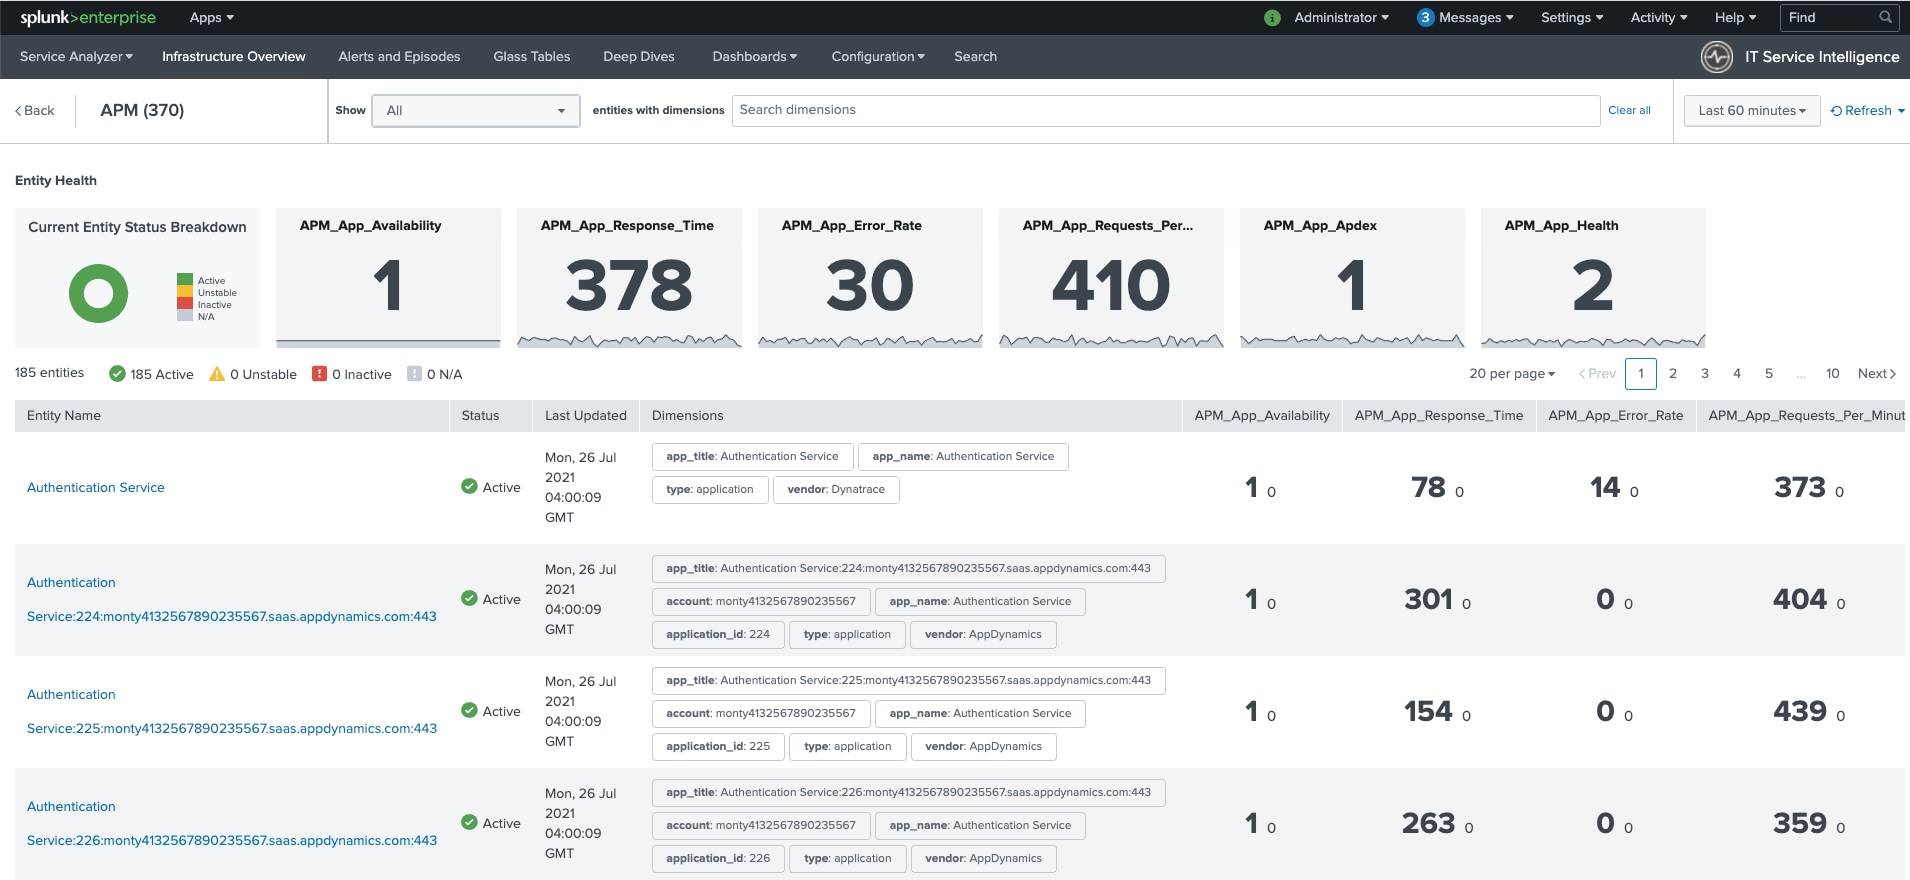
If you want to view and work with entities and entity types, you can do this within the Configuration menu in the Splunk ITSI toolbar.
Vital metrics
Within the Content Pack for Third-party APM you get 6 vital metrics out of the box. These show a critical summary within the entity type via each set of vital metrics that describes the overall health of entities of that type, including:
- Availability
- Response time
- Error rate
- Requests per minute
- Apdex
- Health
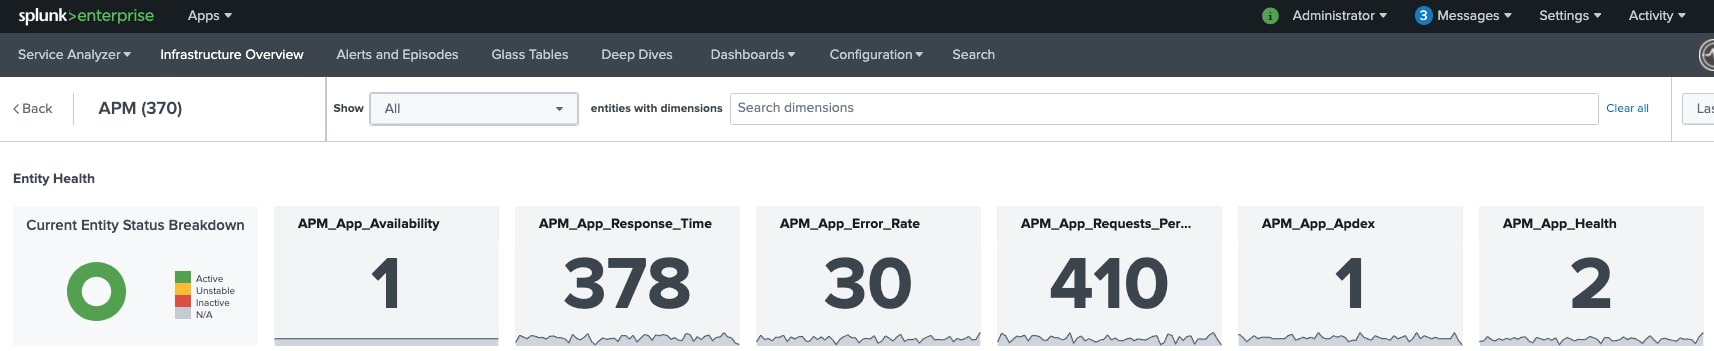
You can view these metrics on the Entity Health page and drill down further into individual entities.
For more information about entity types and vital metrics, see Overview of entity types in ITSI.
Dashboards
A dashboard represents tables or charts which are related to some business meaning. The panels in a dashboard hold the chart or summarized data in a visually appealing manner. You can add multiple panels, multiple reports, and charts to the same dashboard.
Within the Content Pack for Third-party APM, there are 15 dashboards to provide easy access to valuable information in a quick and easy manner for you. These include vendor-specific dashboards as well as dashboards to help you with event searching or reviewing your infrastructure or application as a whole. They provide the ability to filter to specific services and KPIs from there.
To view the APM dashboards, perform the following steps:
- From the Splunk ITSI or the IT Essentials Work menu, select Dashboards > Dashboards.
- Enter APM in the filter field to filter the list of dashboards.
- Select a dashboard to view.
From the Edit menu in this area you can also edit or clone the dashboard to customize it.
Vendor-specific dashboards
The Content Pack for Third-party APM contains several dashboards specific to AppDynamics, New Relic, and Dynatrace. The dashboards included are:
- AppDynamics Applications
- AppDynamics Incidents
- AppDynamics Overview
- Dynatrace Application Overview
- Dynatrace Host Investigator
- Dynatrace Host Overview
- Dynatrace Process Group Instance Investigator
- Dynatrace Service Overview
- Dynatrace Trend Analysis
- New Relic Alerts
- New Relic Insights Data
- New Relic Key Transactions
- New Relic Mobile Applications
- New Relic Web Applications
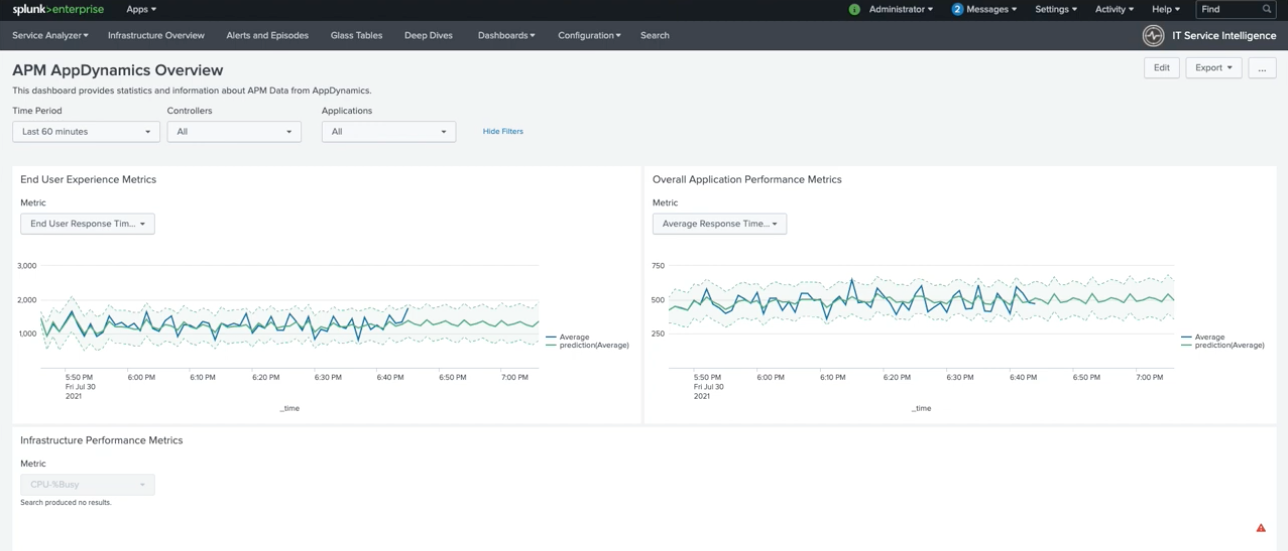
The example below shows the AppDynamics Overview dashboard. In this dashboard, you can filter by time period, controllers, or different applications or services. The dashboard uses predictive analytics to show the KPI ranges that you would expect to see for these vendors.
Event Data Search dashboard
The Event Data Search dashboard displays the 100 most recent log events associated with an entity for the last 60 minutes. The dashboard provides a high-level overview of entity performance across your whole environment, regardless of the entity type you associated with the entity. You can add to, modify, or delete the preconfigured APM entity type.
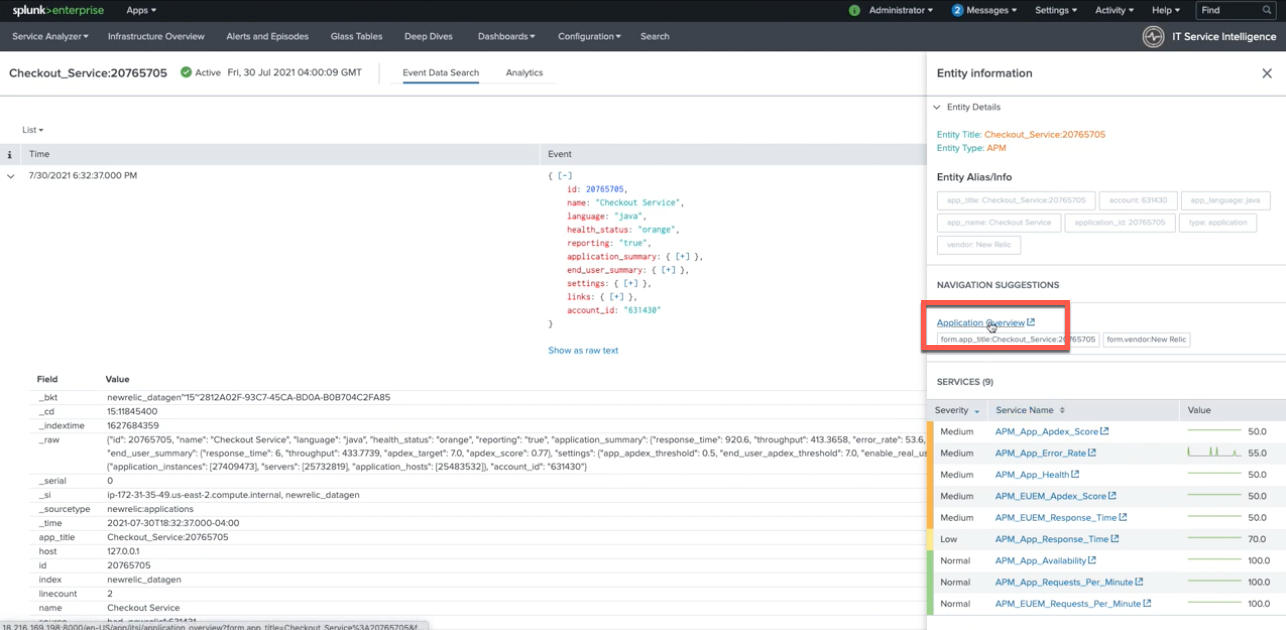
From the Event Data Search you can also click Application Overview to access the Application Overview dashboard.
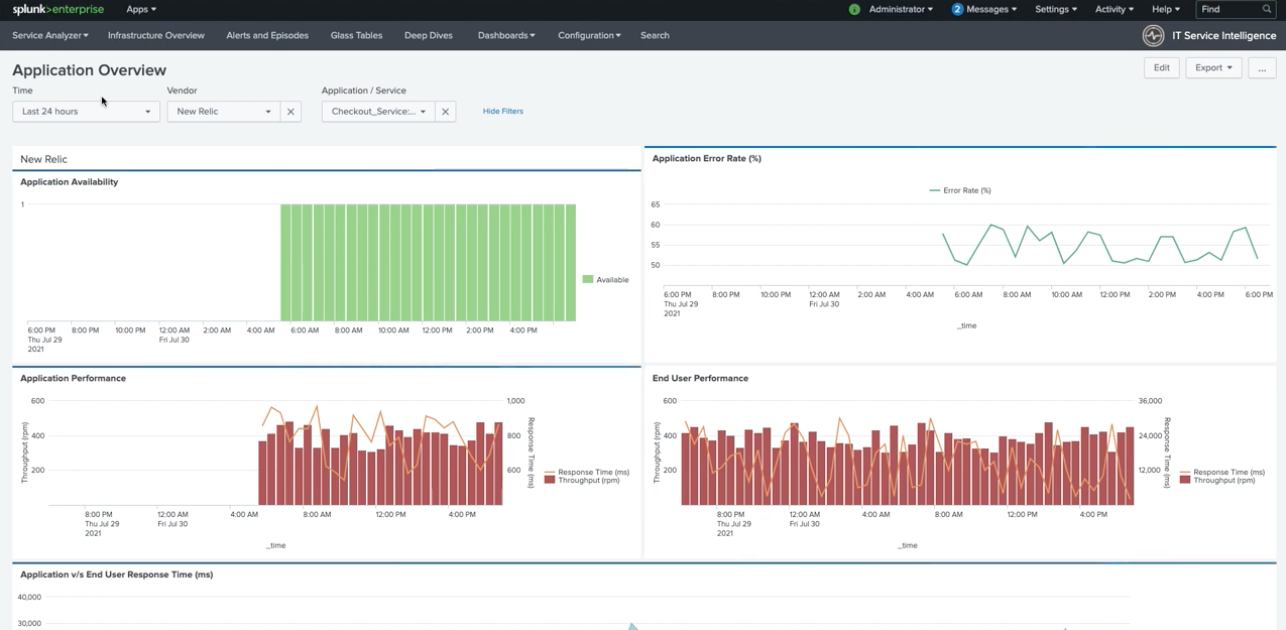
Application Overview dashboard
The Application Overview dashboard provides you with information that can be filtered to a specific service or vendor, including:
- Application availability as well as the error rate percentage.
- Application performance, both throughput and response time.
- End user performance, both throughput and response time.
- A comparison of end user response time and application response time. You can use this to see the differences between the two and identify gaps that might require further investigation.
- Apdex score for application performance and the trend in score changes over time.
- Apdex score for end user experience and the trend in score changes over time.
- A list of searchable events. You could search these events for a term that might indicate performance issues, for example the health status "orange", which then shows events you might want to investigate.
Infrastructure Overview dashboard
You can also find events of interest through the Infrastructure Overview dashboard. Click through to the dashboard from the Splunk ITSI toolbar and select the entity you are interested in investigating.
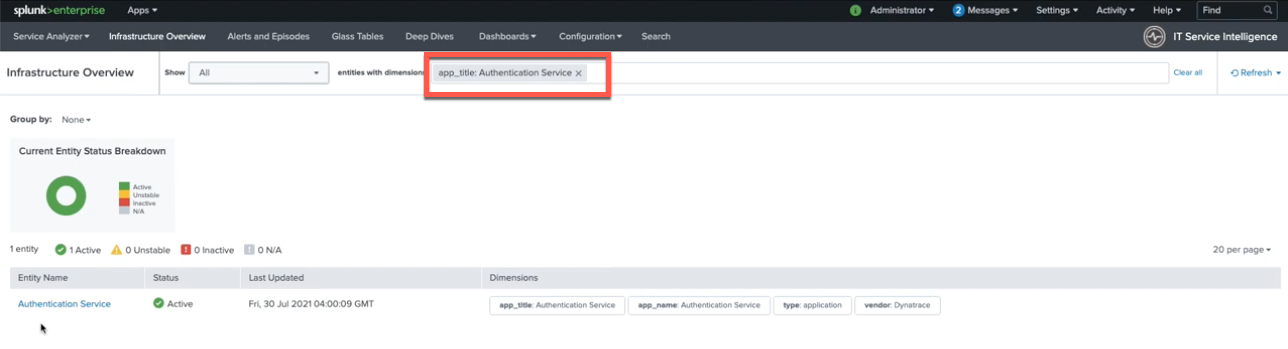
Clicking on the returned entity takes you through to the Event Data search where you can access more information about the entity and view KPIs associated with it.
Additional resources
The content in this guide comes from a previously published blog and a Tech Talk, one of the thousands of Splunk resources available to help users succeed. In addition, these Splunk resources might help you understand and implement this use case:
- Splunk Docs: Content Pack for Third-party APM
- Splunk Docs: Overview of the glass table editor in ITSI
- Splunk Docs: Create custom entity types in ITSI
- Video: Getting started with Splunk ITSI glass tables