Monitoring medical record numbers for anomalous access
As a Security Operations manager of a healthcare organization, you need to monitor authorized and unauthorized access and disclosure of ePHI under the HIPAA statute. You need visibility into disparate clinical applications to
- Identify anomalous user activity.
- Identify risk associated with ePHI data breach.
- Demonstrate regulatory compliance and internal policy adherence.
Required data
Employee data should include, at a minimum, the following fields:
- Employee name
- Hospital affiliation
- Department
- Title
- Status (active/inactive)
- Active clinical applications
Patient data should include, at a minimum, the following fields:
- Medical record number
- Hospital affiliation
- Patient care team
In addition, Splunk recommends that customers look into using data models, report acceleration, or summary indexing when searching across hundreds of GBs of events in a single search. Depending on your data, search time range, and other factors, implementing these features can help you searches scale appropriately.
How to use Splunk software for this use case
Splunk can can collect, normalize, and correlate audit data from many clinical applications such as Epic, Cerner, Meditech, and AllScripts. It can also process employee systems such as Kronos to present key information relating to patient identification (MRNs), user identity, and actions taken over time. Summary dashboards with information from these systems will help you deliver measurable KPIs from your security team and bring insights to your executive team. This visibility can help you move from a reactive incident response state to a proactive risk mitigation approach.
Due to the wide variety of clinical applications and their associated logs, this article provides recommendations of searches to add to dashboards, but it does not provide the SPL for searches.
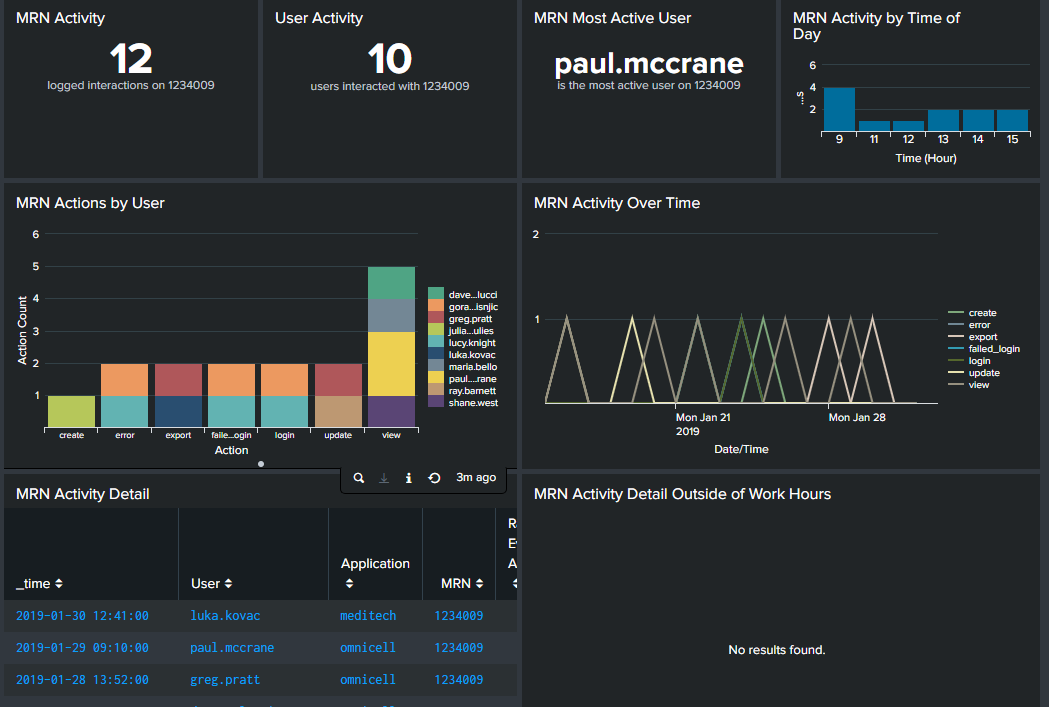
Patient access dashboard
On this dashboard, you should configure filters for clinical application, medical record number (MRN), and date range. Then, you might want to include visualizations for the following searches so that you can see what access has been made to a specific patient's information. While the filters allow you to select any patient, you might also want to create dedicated dashboards for VIP patients, such as politicians or celebrities, who can cause extra security concerns.
- MRN activity. How many interactions took place on the patient's information.
- User activity. How many different users accessed the patient's information.
- MRN most active user. Which employee accessed the patient's information the most. If this person is not on the patient's care team or is not a primary carer, this information can lead you to further investigation.
- MRN activity by time of day. If employees accessed this patient's information during non-active care times of day or times that employee was not working, you might want to investigate further.
- MRN actions by user. Knowing the specific action, such as login or delete, taken can be useful. For example, if an employee exported records but doesn't have a need to do so, you should investigate.
- MRN activity over time. A line graph of actions by time can help you see trends, such as unusual spikes in certain actions.
- MRN activity detail. This table view allows you to quickly reference all actions taken on a patient record in sequence.
- MRN activity detail outside work hours. A line graph of actions by time can help you see whether employees accessed patient records outside their normal working hours.
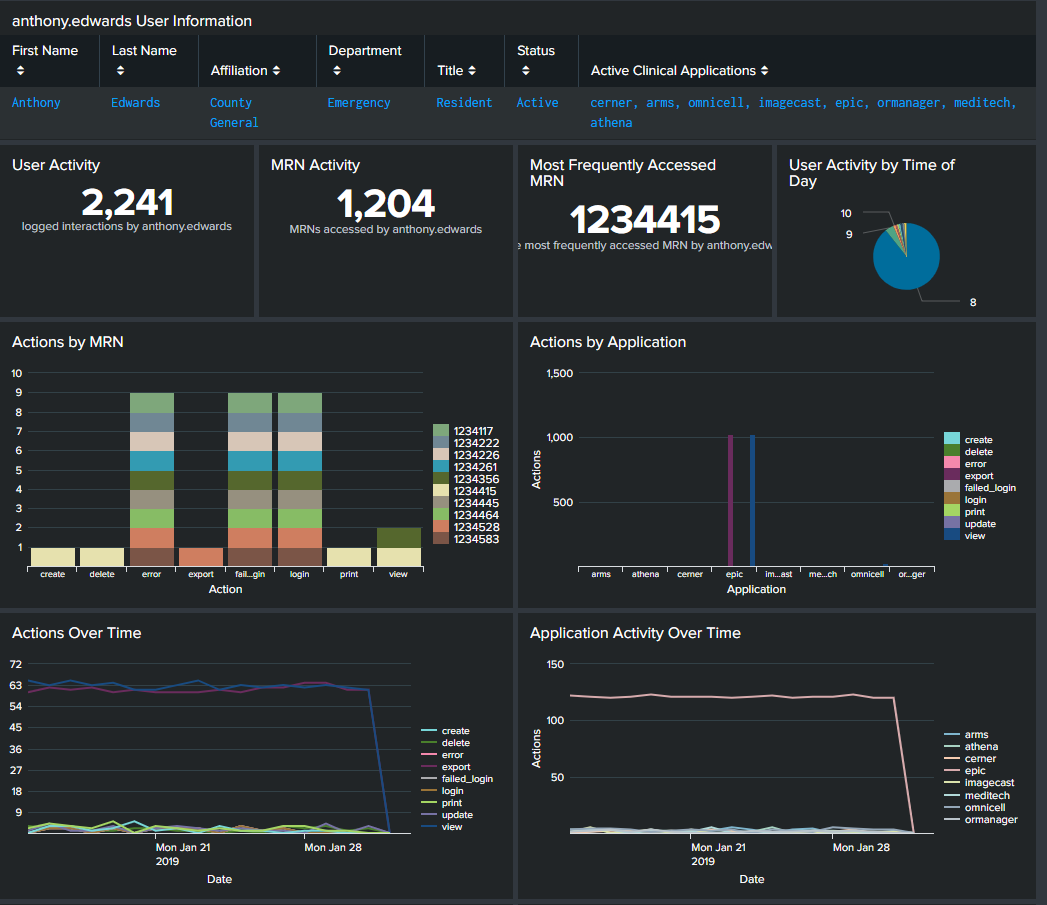
User access dashboard
While similar to the patient access dashboard, the filters on this dashboard allow you to drill into the activity of a single employee rather than a patient. It can help you investigate employees that raised security concerns based on data you saw on the patient access dashboard. You should configure filters for clinical application, employee ID, and date range. Then, you might want to include visualizations for the following searches so that you can see how a specific employee has been accessing facility systems. While the filters allow you to select any active employee, you might also want to create a dashboard for inactive employees to see any suspicious activity from accounts that should have none.
- User information. This provides basic information about the employee, such as name, hospital affiliation, department, and applications the employee has accounts for.
- User activity. This is the total number of actions the employee has taken on clinical applications during the time specified. If you create a filter for action type (login, update, view, delete, etc), this can represent a more specific action.
- MRN activity. This is the total number of patients that the employee has accessed the records of.
- Most frequently access MRN. This is the patient whose records the employee accesses most frequently.
- User activity by time of day. If the employee was active on clinical applications during non-working hours, you might want to investigate further.
- Actions by MRN or application. This bar graph shows all the patients whose records the employee accessed and specifically what actions were taken against those records. You can create a similar graph to show actions by application.
- Actions over time. A line graph of actions by time can help you see trends, such as unusual spikes in certain actions.
- Application activity over time. A line graph of application usage by time can help you see trends, such as unusual spikes in access.
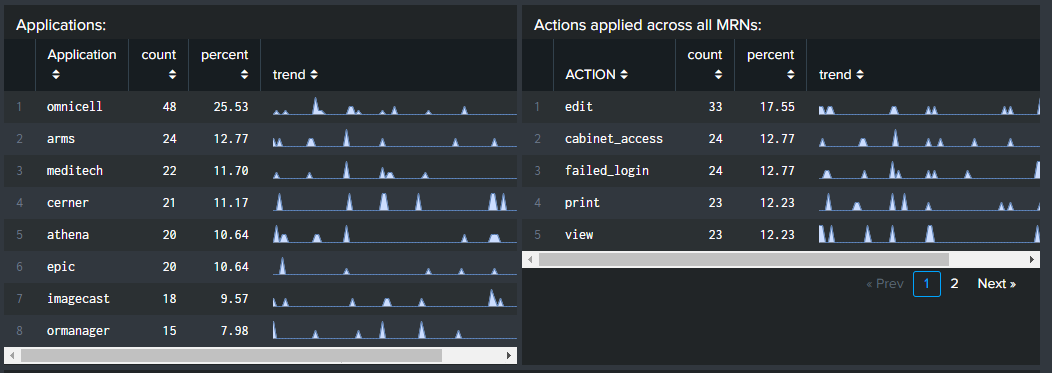
- Applications. This table, sorted by application, shows how many total actions the employee took on each application, what percentage each application represented of total actions, and shows a trend line for quick reference to see unusual spikes. Note that if you have an application filter applied to the dashboard, you will only see results for the application. You can reset the filter to see a complete picture.
- Actions applied across all MRNs. This table, sorted by action, shows how many total actions the employee took across all patient records, what percentage each action represented of total actions, and shows a trend line for quick reference to see unusual spikes.
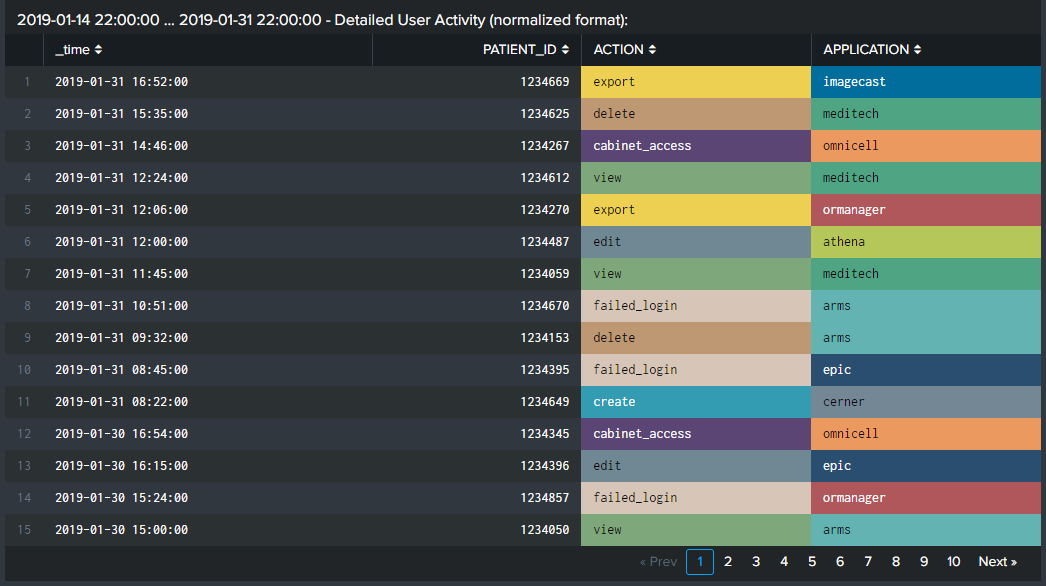
- Detailed user activity. View every action taken, in sequence, by the selected user, along with the application the action was taken on and the affected patient record.
In addition to the visualizations already described and shown below, you might want to configure tables to show how many hours in a day an employee accessed a certain application or how often the employee accesses the application for a period longer than a standard work day. Excessive usage can show when employees access systems outside of working hours, but can also help with labor law compliance and staffing recommendations.
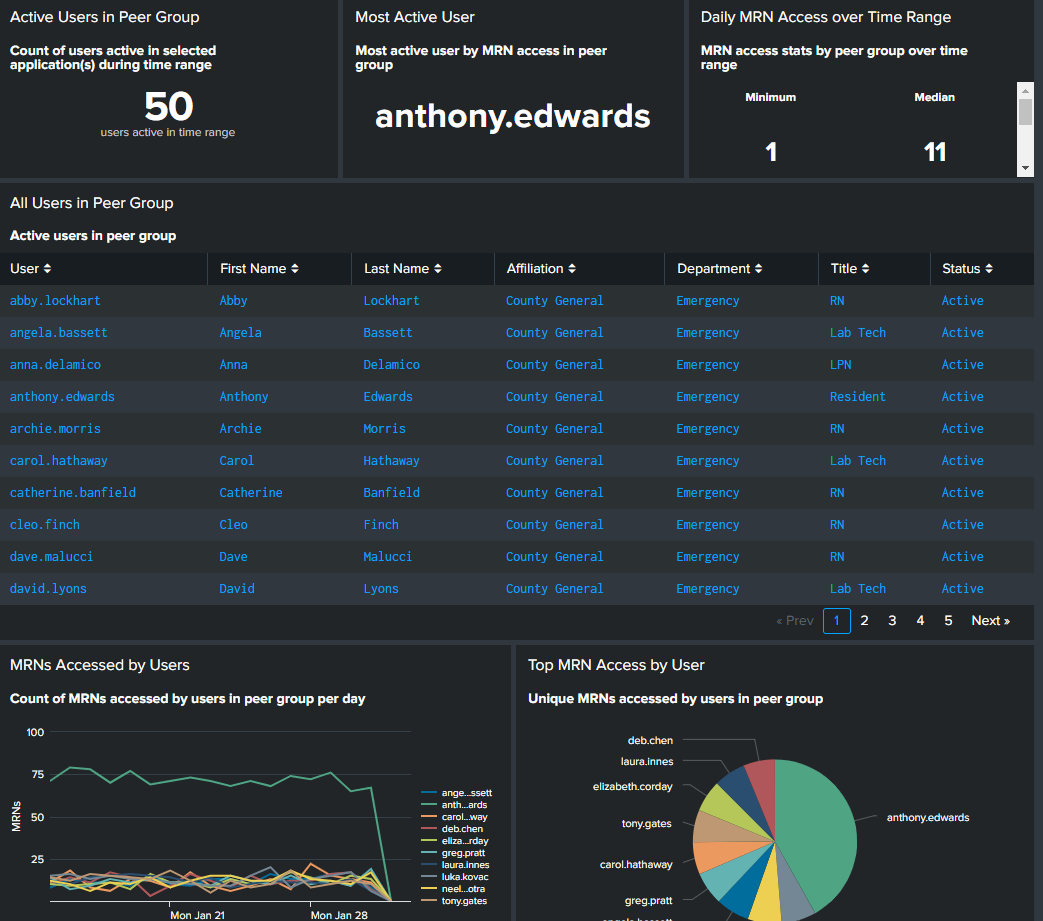
Compare usage among peers
Finally, when conducting an investigation of an employee, you should compare that person's activity to peer activity. What may seem unusual in isolation may not be anomalous at all when correlated against what actions others in the same department or role take. You should configure filters for clinical application, hospital, department, and date range. Then, you might want to include visualizations for the following searches:
- Active users in peer group. This shows you the size of the peer group based on the filters you applied.
- Most active user. This is the most active user in the peer group.
- Daily MRN access over time range. You can configure this panel to show several different meaningful statistical values, such as minimum and median, to help you determine what is and isn't anomalous.
- All users in peer group. This table provides key employee identification information for everyone in the peer group you created based on your filters.
- MRNs accessed by users and Top MRN access by user. A line graph or pie chart of the number of MRNs accessed over time can help you spot a user who accesses records much more frequently than their peers.
Next steps
If you are not currently using Splunk software for medical device security and would like more information, you can contact sales to discuss your environment and assess your requirements.
If you are a current customer in the healthcare industry, most customers have OnDemand Services per their license support plan. Engage the ODS team at OnDemand-Inquires@splunk.
- Resources: Healthcare and life sciences
- Video: Patient flow and medical device security
- Splunk Docs: Dashboards and visualizations