Setting up deployment server apps for the enterprise environment
Getting ready to launch a Splunk deployment in a large-scale environment, or organizing one that has sprawled, can be a daunting task. A lack of planning results in big messes later on, and deploying apps to your forwarders is no exception. Whether you are monitoring only a subset of systems to start or you have a large-scale production environment that sends its data to Splunk Enterprise or Splunk Cloud Platform already, you need an approach that has been proven effective by experienced Splunk architects.
While this document doesn’t cover strategies for app-organization for indexer clusters or search head clusters, understanding the principles here will provide insight to organizing apps on these tiers also. For more information on deployment server clusters, see the official Splunk Documentation.
Solution
Splunk apps are packages of directories with configuration files. In the context of getting your data from their sources to your indexers, whether on-prem or in Splunk Cloud Platform, these files provide the exact instructions for your forwarders to:
- Sync up to your Deployment Server.
- Monitor data sources so they can be picked up and forwarded.
- Apply metadata, such as index and source type, to classify the data (cooking) and determine further processing (parsing) at the indexer tier.
- Configure the destination for the data and encryption, so that data is secure on the wire as it’s being forwarded.
Splunk apps can also include configurations that make adjustments to event breakers, line breakers, and limits. These are out of scope for this article.
In many environments, these configurations get bundled into a unique set for each of many groups of forwarders. Some organizations end up with tens or hundreds of individual groups, making it very difficult to manage changes which need to be made globally or at one "layer" of the bundle.
Instead, the layered approach allows us to provide the correct components to the appropriate groups. The table below depicts how this might take place.
For more information on the configuration files named in the table, see List of configuration files in the Splunk Admin Manual.
| Suggested App | Server Classes | Configuration Files | Description |
|---|---|---|---|
1_all_deploymentclient |
All forwarders get this app. If you have a very large environment, you might have multiple deployment servers, sometimes separated to service groups of forwarders. |
Might include: |
This is the first app you install on your universal forwarders, as it will point them to the deployment server, where they will routinely phone home to have all configurations managed. |
1_all_forwarder_outputs |
All forwarders get this app. If there is a change to the outputs.conf, such as new indexers added to a cluster, they can be changed by editing a single line in this single, global deployment app. |
Might include |
This app configures where your forwarders send data, and any TLS encryption settings and certificates that go with it. The destination may be Splunk Enterprise indexers, Splunk Cloud Platform indexers, or intermediate forwarders, which forward on to the indexers. |
z_all_windows_os_inputs |
Whether a host is running a web server, a custom app, or something else that will be monitored, you probably have one or more set of base inputs that will run on large groups of hosts. For example, there might be multiple organizations running many Windows servers with numerous services or applications that need to be monitored, but what all of them have in common is the requirement to gather a common set of WinEventLogs. There should be an app which is distributed to all hosts to meet this compliance requirement. To avoid gargantuan allow lists, use the machines filter to define what machines get the app according to their operating system. For example: |
inputs.conf |
This is where your forwarders are configured to monitor log files such that they are sent to the outputs.conf destination. On heavy forwarders, this can include HEC (for push-based sources), and scripted (API/collector/pull) inputs to poll cloud sources. On Splunk Cloud Platform Victoria Experience stacks, Splunk Cloud Platform vetted apps can be installed and configured on the search head UI or in the Data Manager. |
windows_dc_inputs |
These are distributed to a subset of hosts with a set of stanzas that override the basic-tier OS monitoring app.
|
inputs.conf |
On top of the base Windows/Linux OS logs, you might have specific hosts with specific needs in addition to your standard OS monitoring. See the examples in the “Server Classes” column. |
<app-name>_inputs |
A list of hosts or a wild carded set of hosts that allows all such hosts to be captured in one or more class names. | inputs.conf |
On top of your standard Windows/Linux OS logs, you might have groups of hosts that require additional monitoring. These might include syslog servers and web servers. |
1_<timezone>_tz_props |
A list of hosts that need time zone defined at the forwarder level for their particular time zone. |
|
While it is best practice in enterprise environments to use UTC as the standard time-zone for all machines, it is common to have groups of machines sending their logs in their local time zone. In many cases, the timestamp itself does not indicate the time zone. In these cases, it can be helpful to deploy a TZ app to override the default or any global TZ configuration you may have. You can then keep a uniform inputs app for the source type, but define the time zone per the appropriate set of hosts. |
In the table above, some app names have a prefix of 1 or z. This is because of the way .conf files are flattened such that each [stanza] has one complete set of each attribute, and any identical attributes takes only one value: the value based on configuration file precedence.
If you have a very large group of forwarders and a subset of those servers need a minor change, such as certain Linux OS scripts disabled or enabled, you could add another app with a higher precedence and the appropriately changed attributes for just those inputs stanzas. You would name the subset app a higher lexicographical order, such as a_all_linux_server_inputs and by adding that app, any identically named inputs stanzas’ attributes would override those in the z_all_linux_server_inputs app. To learn more about this, read the Splunk documentation on Configuration file precedence.
Sample forwarder app deployment
Here are some of examples which use the distribution principles in the table above:
Company-issued Windows laptops
1_all_deploymentclient

1_all_forwarder_outputs

z_all_windows_desktop_inputs
A group of Linux servers running a custom-developed app
In this scenario, the development team “devgroup” has asked for their custom app logs to be ingested. They’ve also requested for infrastructure monitoring so that alerting can inform them if CPU/memory and a specific disk volume are overutilized. In addition, their custom app does not log a timezone, and there are machines in two timezones:
1_all_deploymentclient

1_all_forwarder_outputs

1_<timezone>_tz_props

devgroup_custom-app_inputs

devgroup_infra-monitoring_os_inputs

z_all_linux _os_inputs
Implementing risky configuration changes
Implementing changes to an existing group of forwarders carries substantial risk. Even with a virtual test forwarder or dev environment, it’s common to run into difficult-to-foresee issues which could result in a loss or unavailability of data and have the Splunk teams running fire drills to remediate. If you follow the principles and steps below to leverage deployment app layering, you can greatly reduce the chances and severity of production issues:
- Layer your proposed changes so that they take precedence over existing configurations.
- Instead of removing the existing apps and replacing them with the new apps all at one time, design the new app so that it addresses all of the stanzas and attributes you wish to define going forward.
- The new app should be named at a higher configuration file precedence (for example,
100_new_deployment_appto take over1_old_deployment_app). - To see the final result of every stanza as it is on disk, use the Splunk btool --debug command. Do this on a test host running the existing configurations, or on a single host. Because
btoolreads the configuration files from disk, you can see the resulting configurations as they will be after Splunk Enterprise is restarted.
- After you’ve tested this on a single host and validated the change, move on to a small group of hosts and validate that group before expanding. To test on a subgroup of an existing, large allow list, add the new app to a separate serverclass allow list, which you can expand as you test new tiers. Consider the following:
- Look at the
_internalindex splunk.log to see that the clients have picked up the app. - Check to see if they are still phoning home and doing ongoing handshakes with the deployment server (also splunkd.log).
- Are they sending all of the desired logs?
- Are they sending anything you did not expect?
- Are the logs collected being parsed as desired?
- Look at the
- If working with a very large set of hosts, consider the “catch-up” influx of logs: When you start monitoring a new set of logs, or if you are patching hosts so that they resume sending logs, they may start sending days’ worth of unlogged data.
- This could result in a very large increase in the rate of logs being sent to your Indexers. Will your indexers manage this well?
- This could also result in a very slow catch-up. If you are bringing in logs up to 30d old, how long will it take for logs to catch up and stay current?
- Consider the
maxKBpssetting in [thruput] stanza oflimits.conf. The default, non-configured value is 256KBps.
- If the deployment fails, especially for a crucial configuration such as a change to
deploymentclient.conf, where the forwarder would otherwise be disconnected from the deployment server, you can simply remove the app from those forwarders and restartsplunkdto revert the change. Just be sure to adjust serverclasses accordingly. - If the change is causing problems and you need to troubleshoot, try sending out a temporary change to the
phoneHomeIntervalindeploymentclient.conf(or consider sending this change out in advance of a risky change), so that the test hosts receive and implement changes more quickly. Be sure to avoid this with a very large group of forwarders as that could overwhelm a burdened deployment server.
Helpful deployment client logs
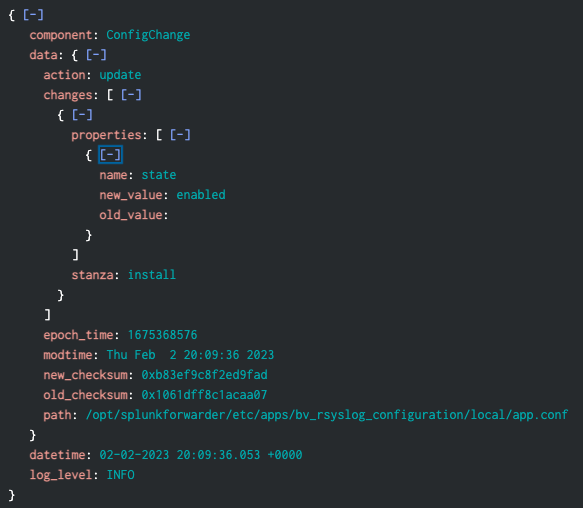
Your Splunk forwarder (whether a Splunk Enterprise or Splunk forwarder instance) writes detailed logs. Splunk platform 9 introduced a very helpful log to track changes to Splunk configurations. These can be found in:
index=_configtracker sourcetype=splunk_configuration_change
Here is a sample. Be sure to explore this new, informative source of new data on versions 9 and later.
All versions of the Splunk platform continue to have the standard splunkd.log, which can be found using the following query:
index=_internal sourcetype=splunkd source=*splunkd.log
If your forwarder is not getting its data to Splunk Enterprise, you can find these on the local instance in:
$SPLUNK_HOME/var/log/splunk/splunkd.log
These deployment client DC:<type> logs look like this:
01-19-2023 04:07:14.923 +0000 INFO  DC:HandshakeReplyHandler [1939 HttpClientPollingThread_1234ABC-4460-4121-BA99-777056CCF6A0] - Handshake done.
01-19-2023 04:12:14.945 +0000 WARN  DC:DeploymentClient [1939 HttpClientPollingThread_1234ABC -4460-4121-BA99-777056CCF6A0] - Restarting Splunkd...
In the above logs, we can see here that, as per the serverclasses, the deployment server has instructed a restart of Splunkd to load the new configurations. Pay special attention to the DC:HandshakeReplyHandler.
Also look at:
01-19-2023 03:46:17.883 +0000 INFO DCManager [1335 MainThread] - No server classes currently installed. Could not find conf=/opt/splunkforwarder/var/run/serverclass.xml
And finally:
01-19-2023 03:53:41.722 +0000 INFO  DeployedApplication [1595 HttpClientPollingThread_1234ABC -4121-BA99-777056CCF6A0] - Checksum mismatch 0 <> 11637150560059352749 for app=my_layered_awesome_app. Will reload from='<IP-Address>:8089/services/streams/deployment?name=default:the_server_class: my_layered_awesome_app '
01-19-2023 03:53:41.725 +0000 INFO  DeployedApplication [1595 HttpClientPollingThread_1234ABC -4121-BA99-777056CCF6A0] - Downloaded url=<IP-Address>::8089/services/streams/deployment?name=default: the_server_class:my_layered_awesome_app to file='/opt/splunkforwarder/var/run/the_server_class/my_layered_awesome_app -1674099871.bundle' sizeKB=220
Next steps
BlueVoyant delivers a comprehensive cloud-native security operations platform that provides real-time threat monitoring for networks, endpoints, and supply chains, extending to the clear, deep, and dark web. The platform integrates advanced AI technology with expert human insight to offer extensive protection and swift threat mitigation, ensuring enterprise cybersecurity. Trusted by more than 1,000 clients globally, BlueVoyant sets the standard for modern cyber defense solutions. Contact BlueVoyant to help evaluate your Splunk maturity today or explore more of BlueVoyant's Splunk services.
The user- and community-generated information, content, data, text, graphics, images, videos, documents and other materials made available on Splunk Lantern is Community Content as provided in the terms and conditions of the Splunk Website Terms of Use, and it should not be implied that Splunk warrants, recommends, endorses or approves of any of the Community Content, nor is Splunk responsible for the availability or accuracy of such. Splunk specifically disclaims any liability and any actions resulting from your use of any information provided on Splunk Lantern.