Applying Benford's law of distribution to spot fraud
When you think of numbers for any categorized set of data and the data is familiar, you have a ballpark idea for the size of each number. For instance, when we think of the size of cities in square miles, anywhere from 10 to 100 is common. However, if someone tells you their city is 8,000 square miles, you instantly realize this statement can't be true.
In that regard, what if you could look at the first digit of each number in a large set and decide whether the generated set is valid or artificially manipulated? This ability could be a useful tool for stopping fraud in financial transactions happening in your organization.
Solution
Benford’s law states that if you take the first digit of any large and random set of natural numbers (such as sizes of rivers (in any measurement unit), baseball statistics, etc.), then the distribution percentage for every digit is not going to be equally represented. You might think that each of the digits 1 through 9 would have an 11.1% distribution rate, but that is not the case. In fact, there is more of a probability that the first digit is a 1, 2, or 3 than an 8 or 9. The application of the rule even works with numbers that are not base 10, and can also be used to predict the second and third digit of each number in the set.
The following table shows the expected distribution of the first digit of a set (Source: Scientific American).
| Digit | Percentage of Numbers That Start With This Digit |
|---|---|
| 1 | 30.1% |
| 2 | 17.6% |
| 3 | 12.5% |
| 4 | 9.7% |
| 5 | 7.9% |
| 6 | 6.7% |
| 7 | 5.8% |
| 8 | 5.1% |
| 9 | 4.6% |
This can help with indications of financial crime because if the natural distribution of the first digit normally follows Benford’s law, then you can assume that a distribution that is totally different might have been artificially manipulated.
For instance, in the United States, all transactions above $10,000 must be reported to the IRS by financial institutions. If a group of people at the same bank are constantly doing $8000 - $9999 range transactions, they might be trying to circumvent the need to report the transactions. If the distribution of the first digit of their transactions is heavily skewed towards digit 8 and 9 as opposed to the normal distribution of the population at hand, this might be an artificial manipulation.
On the other hand, this could also be a false positive as the people involved might have pay deposits that are in that range and are constantly moving that money out to other institutions. This is why Benford’s law is not a physics law, as it is more of a probability for expected distribution. This is also why you need to look at past data in terms of months or even years to get a baseline of distribution patterns for the first digit of a transaction before you apply SPL commands to your current data.
After you understand your baseline, you can use the eval command to get the first character of any string and the top command to get a percentage of distribution for that field. You can also use the convert command to convert this character to a number, but it’s not needed for this purpose. Here are two examples of running these commands on some data sets.
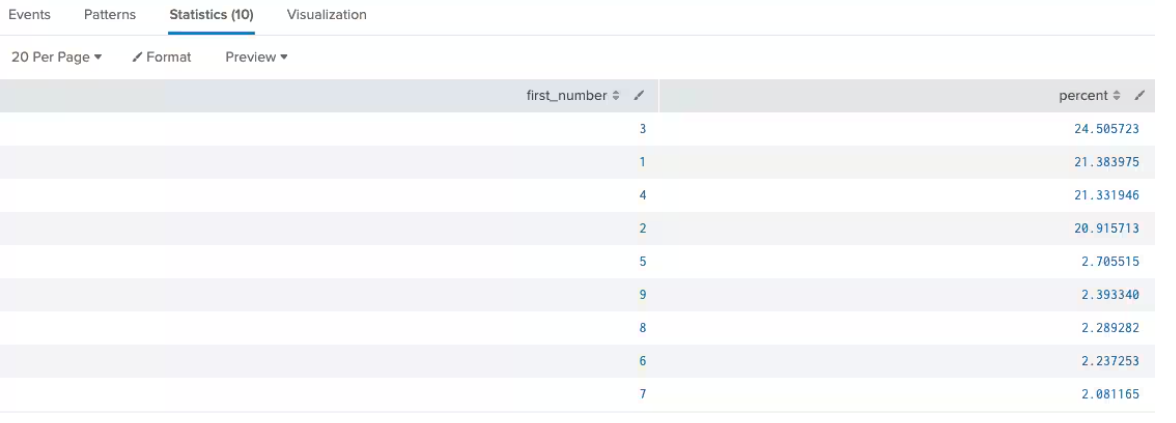
Artifical sample payments
index=payments sourcetype=payments_details
|sort - _time
|eval first_letter=substr(amount,1,1)
|convert num(first_letter) AS first_number
|top first_number
|fields - count
As you can see, the distribution not only favors the higher numbers, but it omits digit one entirely. This sample size is small, but more importantly, this is a known, artificially manipulated dataset that was created for illustrative purposes. Obviously, it is not fraud as it was intentionally created to show distribution percentages, but it does show you how easy it is to track the percentages.
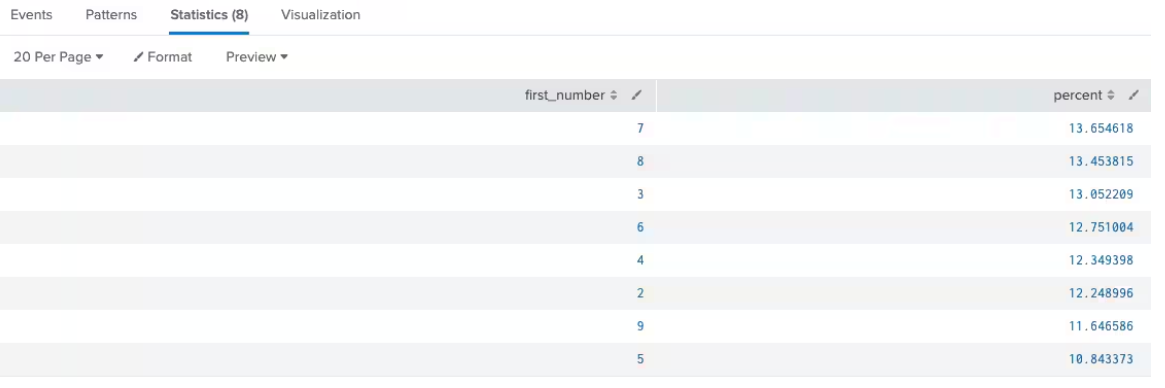
Sample ATM transactions
index=ATM sourcetype=ATM_details
|search action=withdrawal
|eval first_letter=substr(amount,1,1)
|convert num(first_letter) AS first_number
|top first_number
|fields - count
This example for ATM transactions has the lower number digits dominate the distribution, which is more in line with Benford’s law. In this example, the dataset is a couple of magnitudes larger than the previous one and the random distribution is more akin to real life.
Next steps
Regardless of whether you believe in following Benford’s law (and the wise decision is to always think about it as there have been mathematical proofs on why it works), taking a regular percentage distribution snapshot of your transactions in the Splunk platform can give you a baseline of expected behavior. As soon as the distribution percentages change radically from the baseline and there is no obvious explanation, it is worth considering that there is some artificial manipulation of the data, indicating that there could be involvement of fraud. This application of Benford’s law or even your own baselines might influence your risk scores leading to higher fidelity of fraud detection.
This article came from a previously published blog. You might be interested in the following additional resources for financial use cases:
- The Splunk Essentials for the Financial Services Industry app helps you automate the searches to detect financial crime.
- The Splunk App for Fraud Analytics provides a number fraud detection solutions for financial services such as account takeover and new account abuse.
- Blog: Visible risks assessments in the financial services industry