Identifying and quantifying your organization's carbon emissions
Your organization is seeking to address new sustainability imperatives and gain a comprehensive understanding of its carbon footprint. To do this, you need to identify and quantify carbon emissions by creating monitoring dashboards that can be customized to suit your organization's needs.
Data required
IoT and industrial IoT data: Data points you might want to track include:
- Global warming potential (GWP) metrics are used to evaluate the environmental impact of greenhouse gas (GHG) emissions associated with the operation of the data center infrastructure. Data centers consume significant amounts of energy, resulting in the release of GHGs (primarily carbon dioxide (CO2)) but also other gases like methane (CH4) and nitrous oxide (N2O).
- Conversion factors refer to the coefficients or ratios used to convert various data center activities or inputs into standardized units for assessing their environmental impact. These factors are typically used to calculate or estimate the emissions of greenhouse gases, such as carbon dioxide (CO2), methane (CH4), and nitrous oxide (N2O), resulting from data center operations.
You might also want to pull data from relevant private or government sources. For example, the US Energy Information Administration has an API that can be used to leverage standardized metrics such as CO2 emissions data.
How to use Splunk software for this use case
The Sustainability Toolkit for Splunk equips organizations with tools to build a holistic view and gain deep insights into their carbon footprint to align with new sustainability imperatives. Included are visualizations, reports and lookups, which utilize data imported to the Splunk platform by various add-ons.
To quickly and easily create relevant carbon tracking options for your organization using the toolkit, the overall process you'll need to follow is:
- Download the Sustainability Toolkit for Splunk.
- Identify relevant data points.
- Ingest relevant data.
- Identify example dashboards, link data to them, and customize to your needs.
Ingest relevant data
Much of this data can be ingested through importing CSV files. You might also be able to utilize data imported to the Splunk platform through add-ons on Splunkbase.
Identify example dashboards, link data to them, and customize to your needs
Several example dashboards are provided with the toolkit which you can use as a starting point to customize them to your organization's needs.
Carbon Footprint - Executive View dashboard
This dashboard shows metric tons of carbon dioxide equivalent (MTCO2e) metrics, with different areas of the dashboard showing MTCO2e totals, reductions, and YTD metrics.
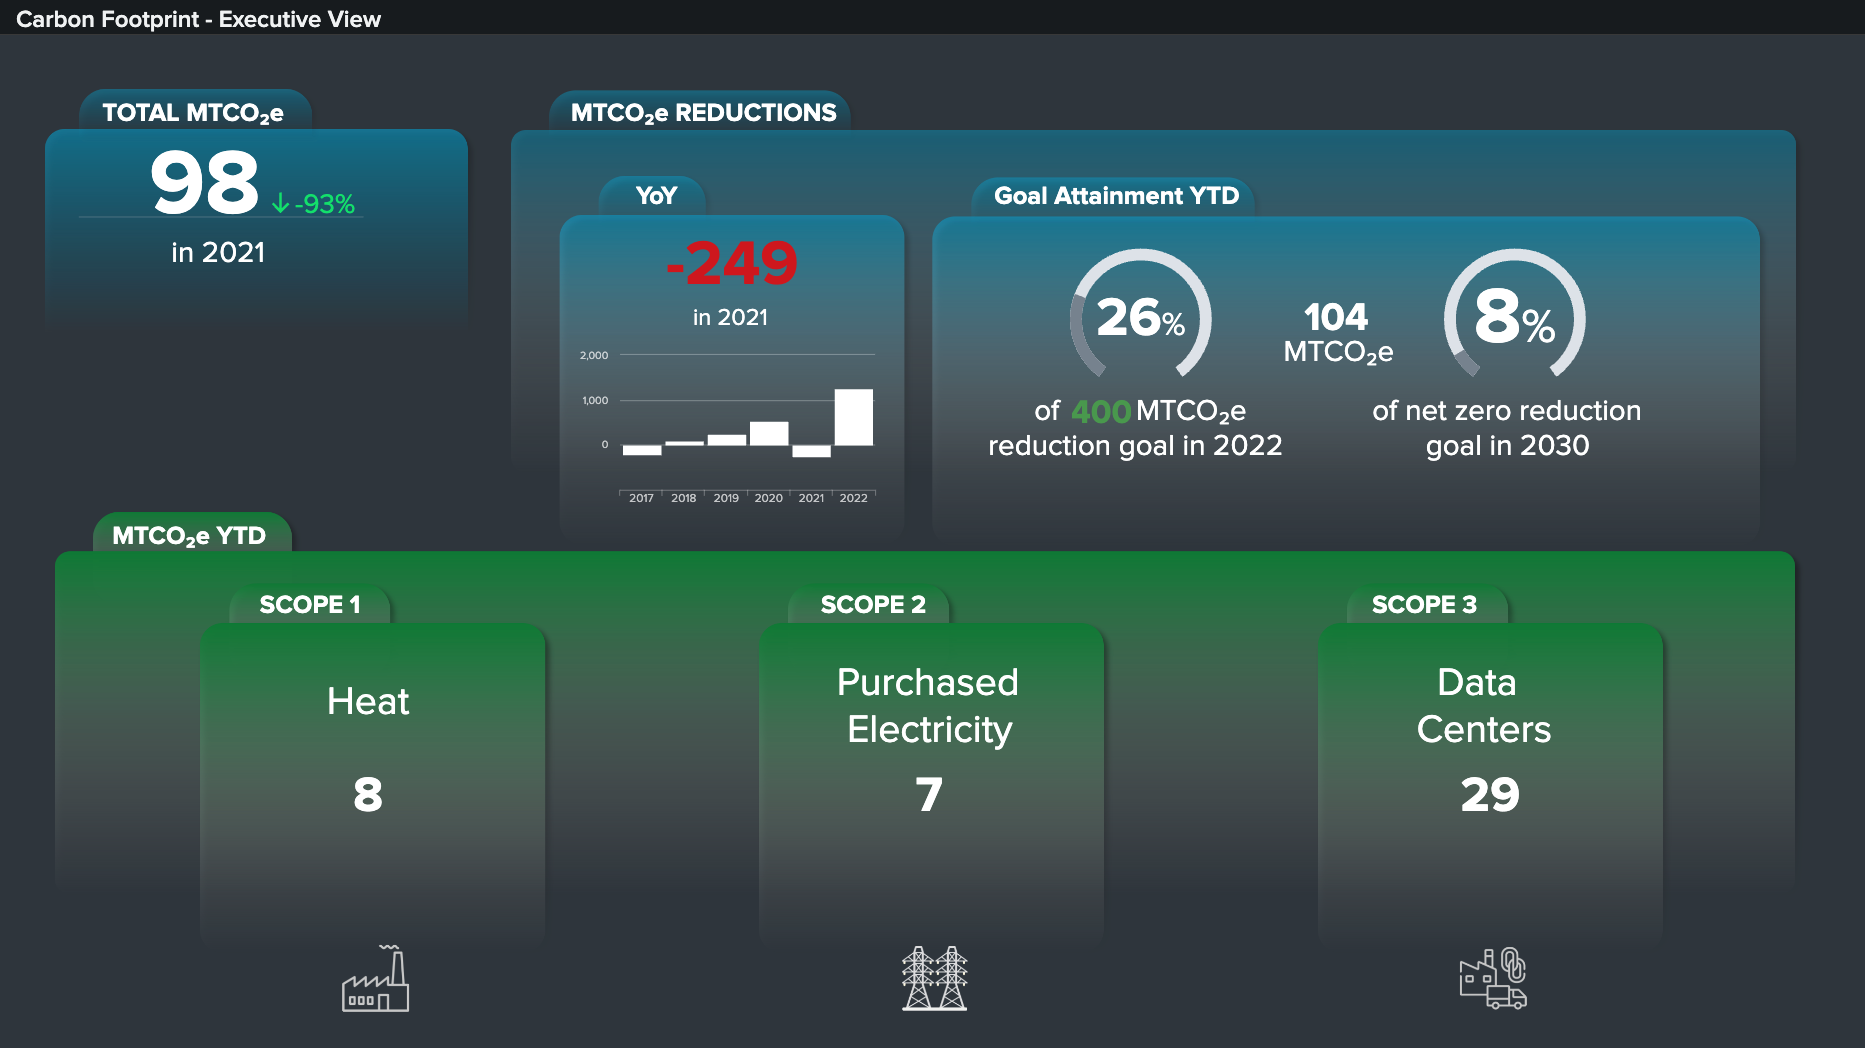
You can use the following SPL as a starting point to visualize your own metrics for the year-over-year (YOY) MTCO2e reductions shown in the top center pane of this dashboard:
| inputlookup <"Dummy_Data_Historic_co2e.csv">
| sort year
| eval total=co2eScope1+co2eScope2+co2eScope3
| delta total AS Difference
| eval Difference=Difference
| where Difference!=""
| fields year, Difference
| eval Difference=-249
Search explanation
| Splunk Search | Explanation |
|---|---|
| inputlookup <"Dummy_Data_Historic_co2e.csv"> |
Retrieve data from the lookup file "Dummy_Data_Historic_co2e.csv" and use it as input for further processing. |
| sort year |
Sort the events based on the year field in ascending order. |
| eval total=co2eScope1+co2eScope2+co2eScope3 |
Calculate the sum of the fields co2eScope1, co2eScope2, and co2eScope3, and assign the result to a new field named total. |
| delta total AS Difference |
Calculate the difference between the current value of the total field and its previous value, and assign the result to a new field named Difference. |
| eval Difference=Difference |
Reassign the Difference field to itself. |
| where Difference!="" |
Filter the events to include only those where the Difference field is not empty, removing any events where the difference could not be calculated or is missing. |
| fields year, Difference |
Select and display only the year and Difference fields, discarding any other fields from the output. |
| eval Difference=-249 |
Override the values in the Difference field and sets them to -249 for all events in the result set, assigning a constant value to the Difference field. |
Datacenter PUE (Power Usage Effectiveness) dashboard
Power Usage Effectiveness (PUE) is a KPI used to evaluate the energy efficiency of a data center. PUE is created by dividing the total energy pulled into a data center with the energy consumed solely by the IT equipment (networking, storage, servers, etc).
A PUE of 1 is an ideal state, with no energy expended on non-critical IT functions. In reality, there are a number of essential devices expected to raise the PUE above the best possible value of 1, such as climate control, lighting, security, and battery backup systems.
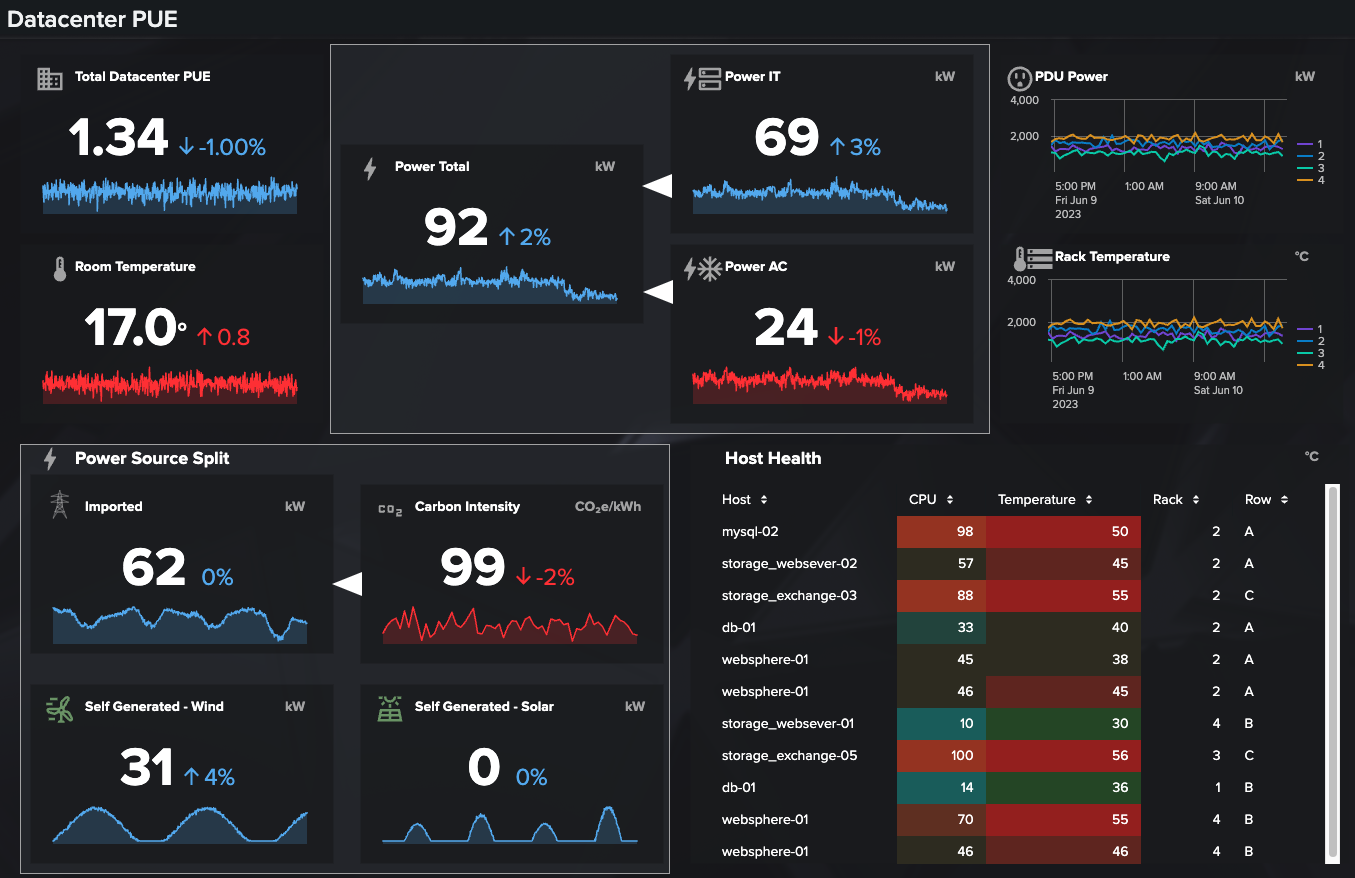
This dashboard example compares the usage of IT equipment measured by rack mounted PDU systems with all other data center systems to calculate PUE over time.
You can use the following SPL as a starting point to visualize your own metrics for comparing the usage of IT equipment measured by rack mounted PDU systems with all other data center systems to calculate PUE over time, as shown in the top left pane of this dashboard:
| index=<power_usage>
| eval PowerImported=PowerUsed-Solar-Wind
| eval AC=exact(PowerUsed*ACPercent)
| eval IT=exact(PowerUsed-AC)
| eval PUE=exact(PowerImported/IT)
| timechart avg(PUE) AS "Total Datacenter PUE"
Search explanation
| Splunk Search | Explanation |
|---|---|
| index=<power_usage> |
Search only the power_usage index. |
| eval PowerImported=PowerUsed-Solar-Wind |
Calculate the difference between the fields PowerUsed, Solar, and Wind and assigns the result to a new field named PowerImported. This field represents the imported power after subtracting solar and wind power. |
| eval AC=exact(PowerUsed*ACPercent) |
Calculate the product of the fields PowerUsed and ACPercent and assign the result to a new field named "AC". This field represents the power used for air conditioning based on the ACPercent. |
| eval IT=exact(PowerUsed-AC) |
Calculate the difference between the fields PowerUsed and AC and assign the result to a new field named IT. This field represents the power used for IT equipment after subtracting air conditioning power. |
| eval PUE=exact(PowerImported/IT) |
Calculate the quotient of the fields PowerImported divided by IT and assign the result to a new field named PUE. This field represents the Power Usage Effectiveness (PUE) of the datacenter. |
| timechart avg(PUE) AS "Total Datacenter PUE" |
Generate a time chart that calculates the average value of the PUE field over time. The resulting chart will have the timestamp as the x-axis and the average PUE value as the y-axis. |