Using risk scores to improve decision-making
There are many types of risks in the financial services sector - the impact of errors, uncertainty associated with the economic climate, liquidity concerns, and more. It's important for management departments, auditors, and compliance departments in financial services organizations to have quick access to reports and data that allow them to assess the impact of risks. By using this data efficiently, they can make better decisions, reduce their risk exposure, and stay compliant with regulations.
Although the examples and subject matter of this article focus on the financial services industry, the concepts transcend industry.
Data required
Solution
Incorporating risk scores or assessments into dashboards and glass tables provides decision-makers with one more data point to make correct decisions. The scores can be computed in near real-time and can also trigger alerts based on the threshold conditions. Common methods of computing risk scores include the following:
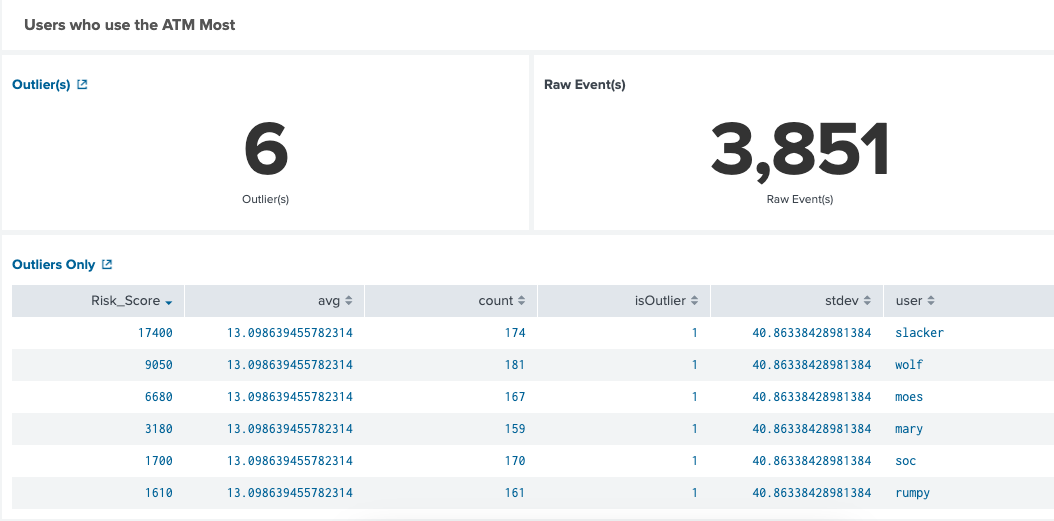
- Simple aggregate of scores. Assign a fixed score to each event that contributes to the risk score (for example, 100) and add up all scores split by a value like customer, employee ID, or account ID. For example, every time a customer accesses an ATM, their risk score goes up by 100. The customers who accessed ATMs the most in a given time period get the highest risk scores, as seen in the first column in the table below:
- Exponential aggregates. The first time you see an event that contributes to a risk, give it a score of 2. The next time, use 4, then 8 then 16, and so forth. For example by increasing a risk score exponentially each time a login attempt fails, you can find the riskiest users.
- Weighted scores associated with events. Some events, like losing money due to non-payment, contribute slightly to risks. Give that event a weight, say 100. Then, if an entire network has an outage, give that a weight of 1,000. Finally, if the CEO quits, give that a weight of 10,000. Add up all the risk scores on a fixed interval (maybe daily) to assess the company's performance.
- Ratios. For instance, the number of failed logins per region over the number of successful logins in the same region. Classify the ratio, maybe <0.1 as good, >0.1 and < 0.2 as fair, and anything over 0.2 as bad and alert-worthy.
For more information on creating risk scores, see Using modern methods of detecting financial crime. The remainder of this article describes use cases where applying risk scores to search results will make your analysis and response more efficient and accurate.
IT risks
Customers can be driven away by issues such as payment system unreliability. Using your application response time data, you can use timechart avg(ResponseTime) AS ResponseTime for any time period and compare time periods to previous ones using the timewrap command. The resulting chart shows variations in system performance, but adding a risk score to the information makes it easier to identify where a response time deviated too much from the mean.
Regulatory risks
Regulatory risks are usually highly visible because they are connected to governments. For example, where sanctions are put against a country and it is forbidden to perform wire transfers to this country, outside auditors expect time series reports showing where money was transferred. Using the Splunk platform and tracking the destination of a wire transfer from the time series events generated by the application can provide that information, as shown in Detecting wire transfer fraud.
A dashboard panel can tell a compliance department about violations, and alerts can be invoked as the violation happens. However, that information would be more helpful with a visible risk score on the dashboard as well. The risk score percentage could be based on the number of violations per the last time period, all the way to the second when it happened. This information helps teams make quicker decisions on what to do next, such as lock down the account and investigate the code that allowed the transfer or the threat list that omitted the sanctioned entity, rather than wait for an auditor to discover this violation.
Business risks
Suppose you run a payment service and want to monitor the time series data generated by transactions every time a customer makes a payment. You might also want to monitor the top customers in terms of the number of payments they make in a week. This sounds simple enough to calculate using a stats count by customer command, as shown in Monitoring payment responses.
But a list of customers who made the most payments by itself isn't necessarily enough to tell if the results are good or bad. Suppose your company has a control that states it is expected that the top 10 customers each make at least six payments per week to indicate that the business is healthy, otherwise there is a danger to the business. A dashboard with the list of top 10 customers would be more useful if it also indicated which, if any, of the top 10 customers did not meet this threshold. The indicator could be a color, a number, or a percentage, or some combination of these.
Another useful risk score is one that monitors the stability of the business. Suppose that you have an Splunk ITSI glass table that shows key performance indicators (KPIs) for the business of credit card payments. One of the KPIs could be a risk score calculated based on fraud attempts. You can calculate a risk percentage for the initialization of the transaction and, for example, base it on the fraud alerts in the last hour. Not only would a compliance or risk department want to know about this, but the fraud department would also be very interested in this report too. For more information on KPI thresholds, see Configure KPI thresholds in ITSI.
If you wanted to add a risk score KPI for a claims processing report, you might base it on the number of outstanding claims that have not been processed in the last 48 hours. In this situation, the compliance department would like to know the number of claims that missed SLA deadlines, while the risk department would like to know the risk associated with the issue.
Next steps
To make your analysis and response to these risk scores more seamless, Splunk SOAR can automate responses to these alerts with playbooks to mitigate issues and further reduce risks.
You might be interested in the following additional help for financial use cases:
- The Splunk Essentials for the Financial Services Industry app helps you automate the searches to detect financial crime.
- The Splunk App for Fraud Analytics provides a number fraud detection solutions for financial services such as account takeover and new account abuse.
- Blog: Visible risks assessments in the financial services industry