Following best practices for working with classic dashboards
Dashboards are a great way to organize and communicate data insights. They help users monitor or learn about important metrics and trends. However, setting them up and running them isn't always as simple as you'd like it to be. Editing the XML (in Enterprise or Cloud) can be time consuming and cumbersome. You need some ways to make dashboard setup and maintenance easier.
Here are four ways you can work with dashboards more effectively:
- Use base searches
- Use text inputs with tokens for conditional logic
- Preload drilldowns
- Embed saved searches
Use base searches
Running lots of separate searches might cause your to bump up against quotas and other limits and can negatively affect performance. If you use a base search as a starting point to build other searches from, you can avoid these issues.
You can use multiple base searches on a dashboard, but there are a few caveats to using base searches.
- They work best with transforming searches (in Enterprise or Cloud).
- They have a 50,0000 returned event limit and require field references for non-transforming searches.
- They have a 30 second search limit.
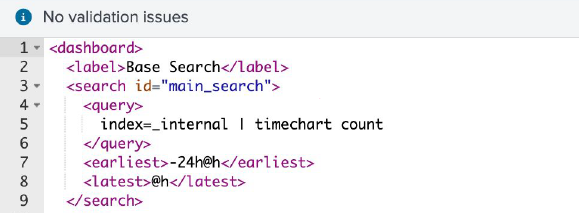
Build a new base search
You can build a base search directly in the XML. This example has a search ID of "main_search", and it sets the index, sets the time range, and creates a timechart.
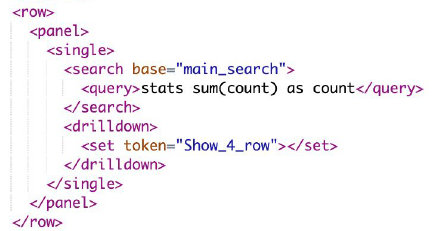
Then use the search ID you created to add the search to a panel. This example adds a stats command to the base search.
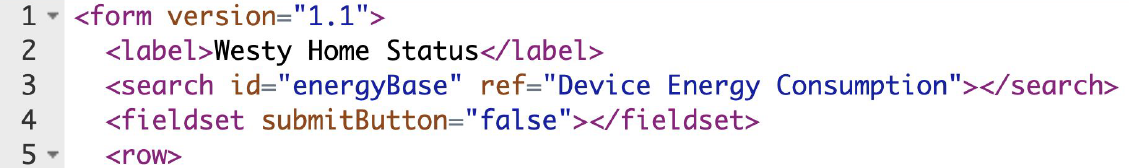
Reference a saved search
A second option for building a base search is to reference a saved search. Saved searches are easily reusable across many dashboards, and if they run on an interval, the dashboard always displays the latest information. This example has a search ID of "energyBase" and references the saved search "Device Energy Consumption".
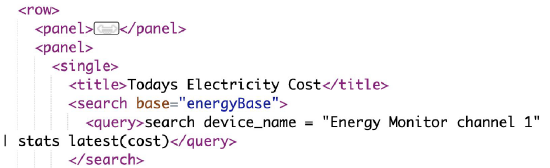
Use the search base attribute to reference the base search ID. This example also adds a stats command to the base search.
Use text inputs with tokens for conditional logic
Tokens (in Enterprise or Cloud) are variables you can use to make your dashboards interactive. For example, you might use them for drilldowns, using set or unset to define which drilldowns apply to which panel. However, in dashboards with lots of panels and lots of tokens, this process can become time-consuming and prone to error, as you have to set or unset each panel separately.
A better way to manage tokens is by creating a single token that hides all other tokens by default.
- At the bottom of your XML, create a row that is always hidden using
depends="$always_hidden$". This is where your inputs for the token will live. On the dashboard, you can tell the row is hidden because it has a dotted line border. - In the first set of inputs:
- Define the
hide_row_1token. - Configure all drilldown tokens to
unset. - Create a form input that will show the drilldown token you request using
<set>token="form.show_row_1">$value$</set>.
- Define the
- In the second set of inputs:
- Define the
show_row_1token from the first set of inputs. - Set conditional values for all your other tokens.
- Define the
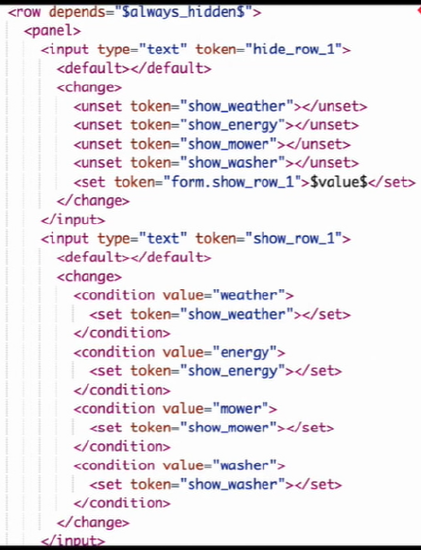
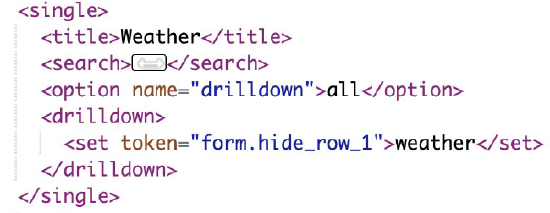
Now, in your drilldown, you can use the hide_row_1 token to hide all drilldowns except the one you specify, which is "weather" in the example below.
If you need to make additional changes, you only have to edit the inputs on your hidden row instead of each panel in your dashboard.
Preload drilldowns
Drilldowns (in Enterprise or Cloud) can take a long time as you wait for a search to run again. Instead, you can use a drilldown search from a parent dashboard and reload it into a target dashboard.
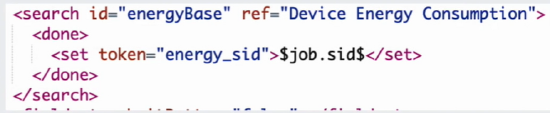
When a search completes, use the change event handler (in Enterprise or Cloud) of "done". Assign the search ID sid job property with $job to a token with a name related to the search, as shown here:
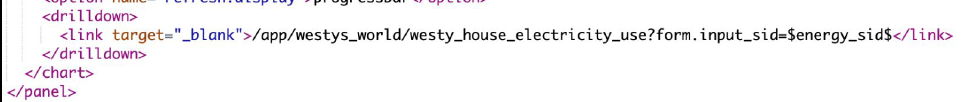
Next, add the drilldown block to your panel. Identify your target dashboard and then use form.input_sid to pass the token. You don't have to use an input (in Enterprise or Cloud) to pass the token, but doing so gives you greater flexibility for conditional handling.
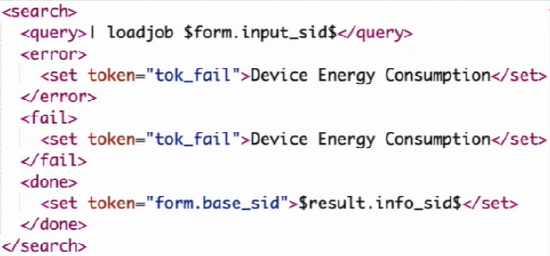
Finally, in the search block, use loadjob to add the form input. You can also set further tokens that define actions to take if the search results in an Error, Fail, or Done, as shown in this example:
Embed saved searches
If you have a search that is saved as a report and you want to embed it in your dashboard, you must use an iFrame. However, this means the search cannot be edited until you disable the iFrame. Then you make your edits and create the iFrame again. This is especially problematic if you have the search embedded onto multiple dashboards.
A faster way to edit this search is to realize that saved searches are macros, which you can edit directly. In the edit menu, select Open in Search and you will see the macro name, identified by the back ticks that surround it. Find the macro in Settings > Advanced Search > Search macros and edit it as needed.
For more information, see:
- Use search macros in searches (in Enterprise or Cloud)
- Define search macros in settings (in Enterprise or Cloud)
Next steps
The content in this guide comes from a .Conf21 breakout session, one of the thousands of Splunk resources available to help users succeed. In addition, these Splunk resources might help you understand and implement this use case:
- Splunk 2021 BSides: Dashboarding Wowzas
- White Paper: Dashboards quick reference guide