Using high-cardinality metrics in monitoring systems
Your organization has recently gone cloud-native. This has bought benefits but also challenges. Having all of your data together in one platform and unified by OpenTelemetry makes it easier to connect the alert that signaled the problem to the errors that are happening in the service. You are adding an increasing number of data sources, which increases datapoint volume while also increasing the difficulty you experience in gaining insights from your data, which is currently not labeled or sorted into dimensions.
Here is an example of what your metrics might look like without the use of dimensions or labels.
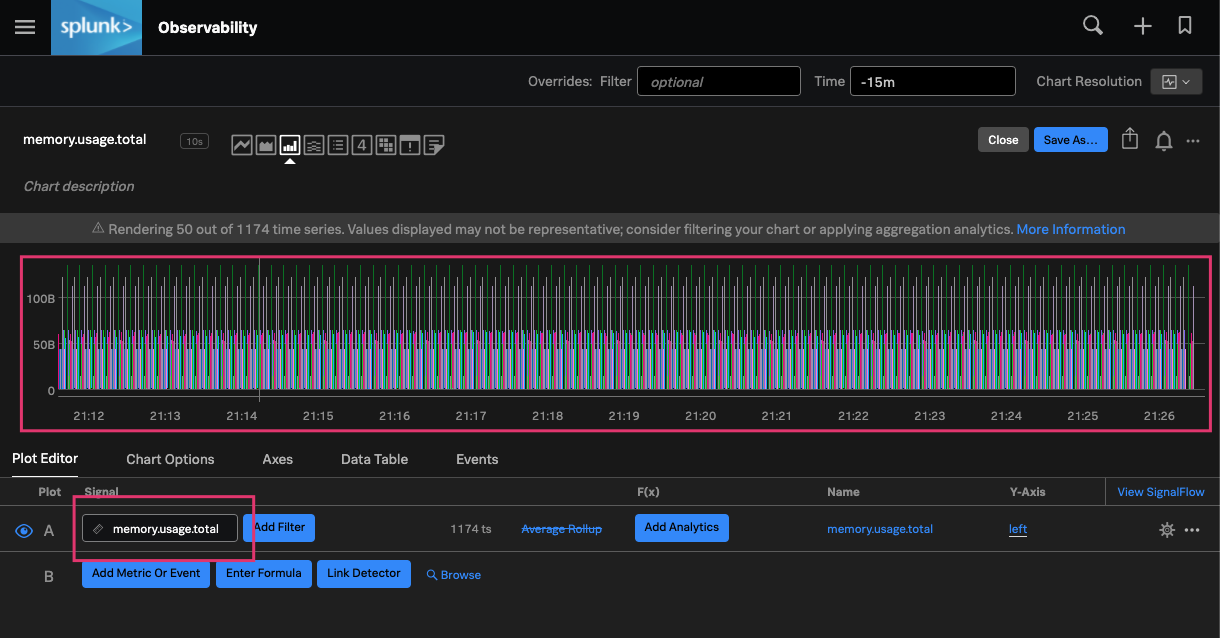
Using the Splunk Observability Cloud Metric Finder, you can see there are an overwhelming number of pod memory usage metrics. With over 1000+ pods deployed in this environment, this data can be overwhelming and difficult to understand without adding a label (such as cardinality) to these metrics. Cardinality is the number of elements in a set. As it relates to monitoring, cardinality is the number of individual values of a metric. For example:
- When monitoring an application containing only two HTTP methods, GET and POST, would result in the cardinality of 2.
- Support for an additional HTTP method (e.g. HEAD) would then increase the cardinality of this application to 3.
Each one of these metrics is stored in your monitoring system’s time-series database (TSDB) as a metric time series (MTS). Generally, a metric time series (MTS) is the unique combination of a metric name (HTTP Method) and any number of key-value pairs (GET, POST) known as dimensions or labels.
What use cases require use of high cardinality metrics?
Labels that create cardinality let you slice and dice metrics by various groups. Here are some examples where high cardinality metrics could help. The dimension that unlocks the value in each example here is italicized.
- Understanding your customer experience. For example, a set of APIs that you expose to users. Maintaining SLAs to customers for uptime and performance of those APIs would require monitoring request rate, errors, and duration for each of your services and whether performance varies by user.
- Planning for suitable capacity. Forecasting infrastructure capacity requires historical data on resource utilization for each service to see trends over long periods.
- Phased deployments. Monitoring performance metrics during a canary or blue/green deployment.
- Immutable infrastructure. Replacing every container for every code push with newly replaced containers with a common image that contains the new code changes. In this use case, each new container is identified by a unique time series, unless a label is added unifying the containers together.
Use high-cardinality metrics in monitoring systems
Adding multiple labels creates MTSes that are considered high cardinality. This is because each combination of metric and dimension value is seen as a unique time series. Because of this, high cardinality allows for better monitoring by providing better filtering for captured metric time series.
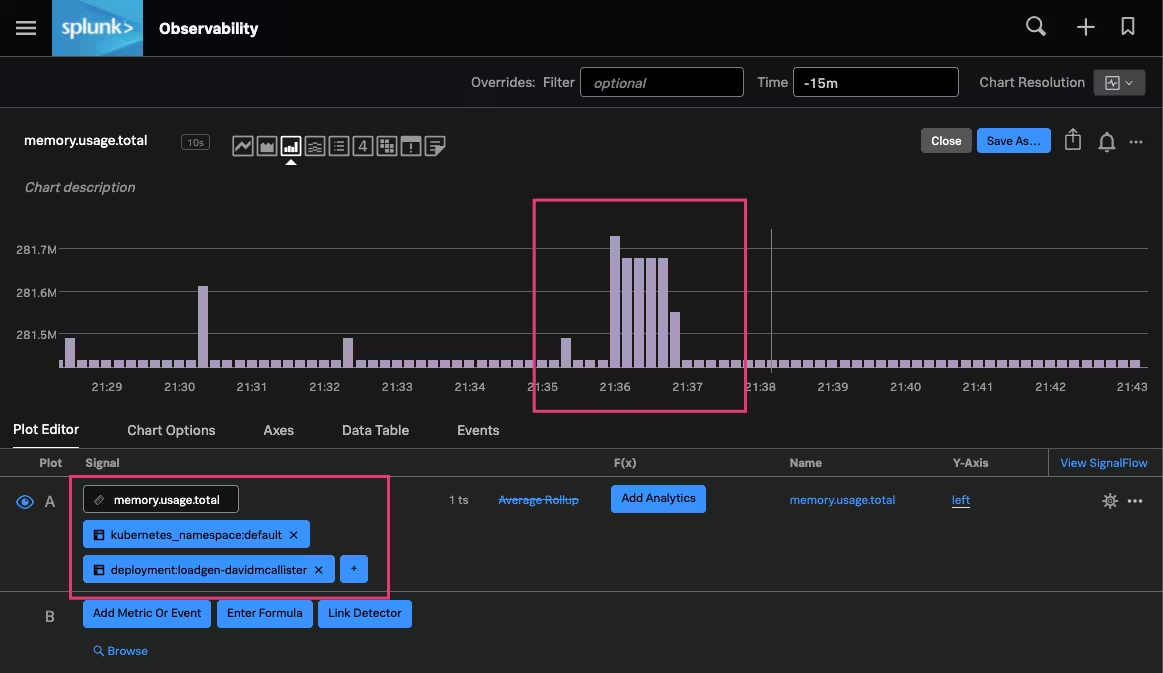
Here are two examples of Kubernetes pod memory usage metrics. In the example before, the data is displayed as-is with no labels. In this example, adding dimensions (kubernetes_namespace and deployment) allows you to quickly find high memory utilization in a particular time period of the example deployment.
As infrastructure becomes cloud-native and development practices evolve, it is possible to have hundreds or even thousands of different services, sending upwards of millions of data points per second. Unlike collecting only infrastructure metrics and looking at individual components (servers), as infrastructure practices evolve organizations are also instrumenting their application workflows to provide visibility to critical microservices and monitoring based on similar groups (Kubernetes nodes, pods).
Using these non-standard tags and dimensions to slice and dice data causes high cardinality, adding power to your data so you can answer questions like:
- What products do my customers purchase the most?
- Are my Kubernetes containers evenly distributed across deployed Kubernetes nodes?
- How many 500 errors occurred during high traffic times?
- Does each of my microservices have adequate resources?
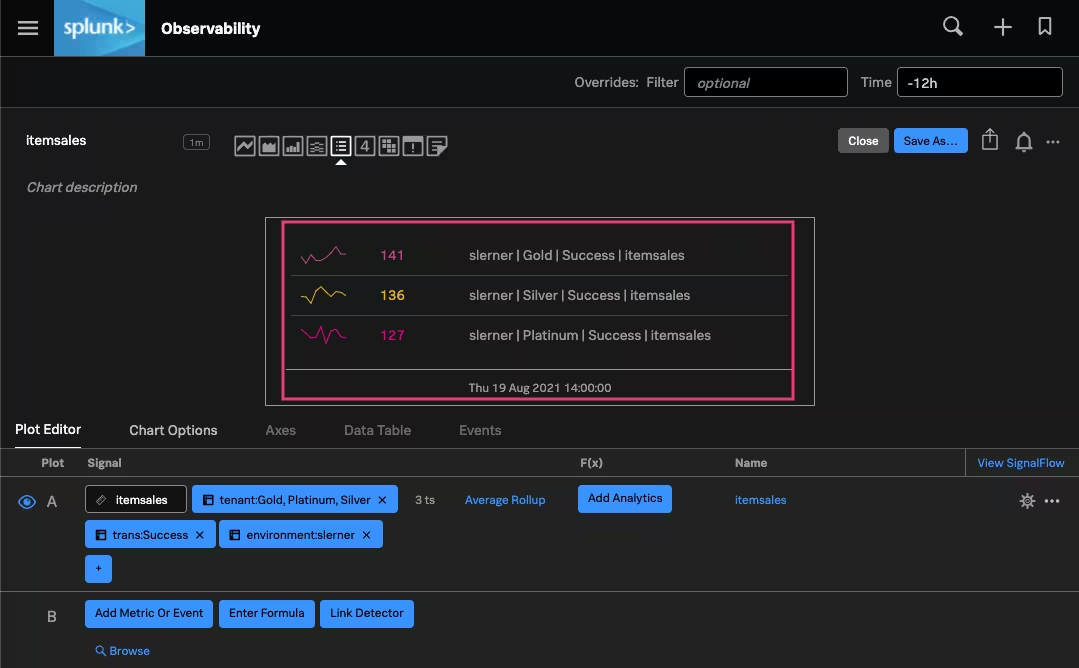
Here is an example of the value of these detailed metrics: answering how many successful item sale transactions have occurred within a 12 hour period. In the example below, each customer tier (Gold, Silver, and Platinum) shows roughly about 120+ different successful item sale transactions. If you can identify that the success rate is different by customer tier, you can investigate further. Without adding this information at the time of ingestion, you would be unable to determine if such a difference existed.
Next steps
The content in this guide comes from a previously published blog, one of the thousands of Splunk resources available to help users succeed. In addition, these Splunk resources might help you understand and implement these recommendations:
- Docs: Metric Finder