Using Log Observer Connect with Cloud Platform
Splunk Log Observer Connect is an integration that allows logs on Splunk Enterprise or Splunk Cloud Platform to be queried and associated with Related Content in Splunk Observability Cloud. With Splunk Observability Cloud, you can troubleshoot your application and infrastructure behavior using high-context logs. You can perform codeless queries on your Splunk Enterprise or Splunk Cloud Platform logs to detect the source of problems in your systems, then jump to Related Content throughout Splunk Observability Cloud in one click. Seeing your logs data correlated with metrics and traces in Splunk Observability Cloud helps your team to locate and resolve problems exponentially faster.
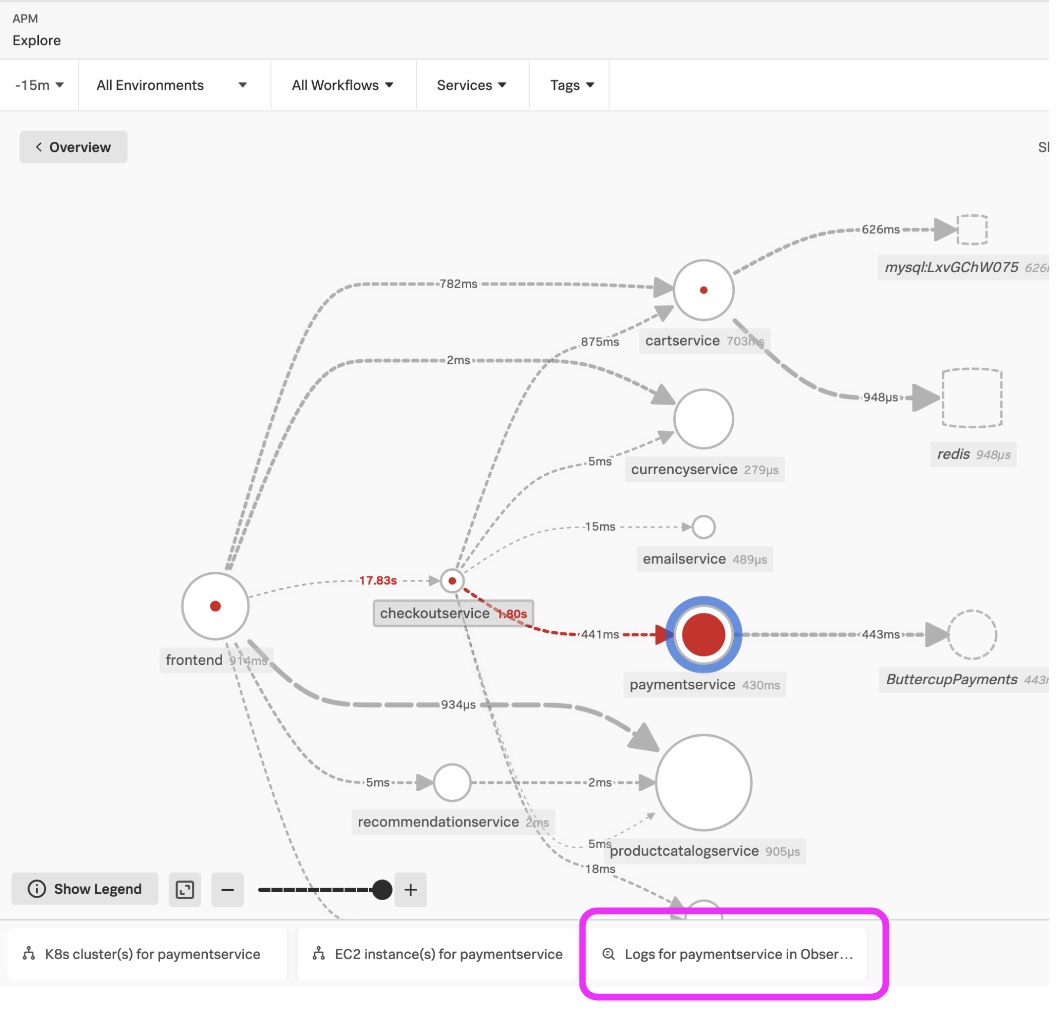
The diagram below shows how this works. Note the tab Logs for paymentsservice in Obser.. at the bottom of the Splunk APM Service Map. Click this to see the logs in the context of the paymentservice service selected and in the time frame selected for the service map.
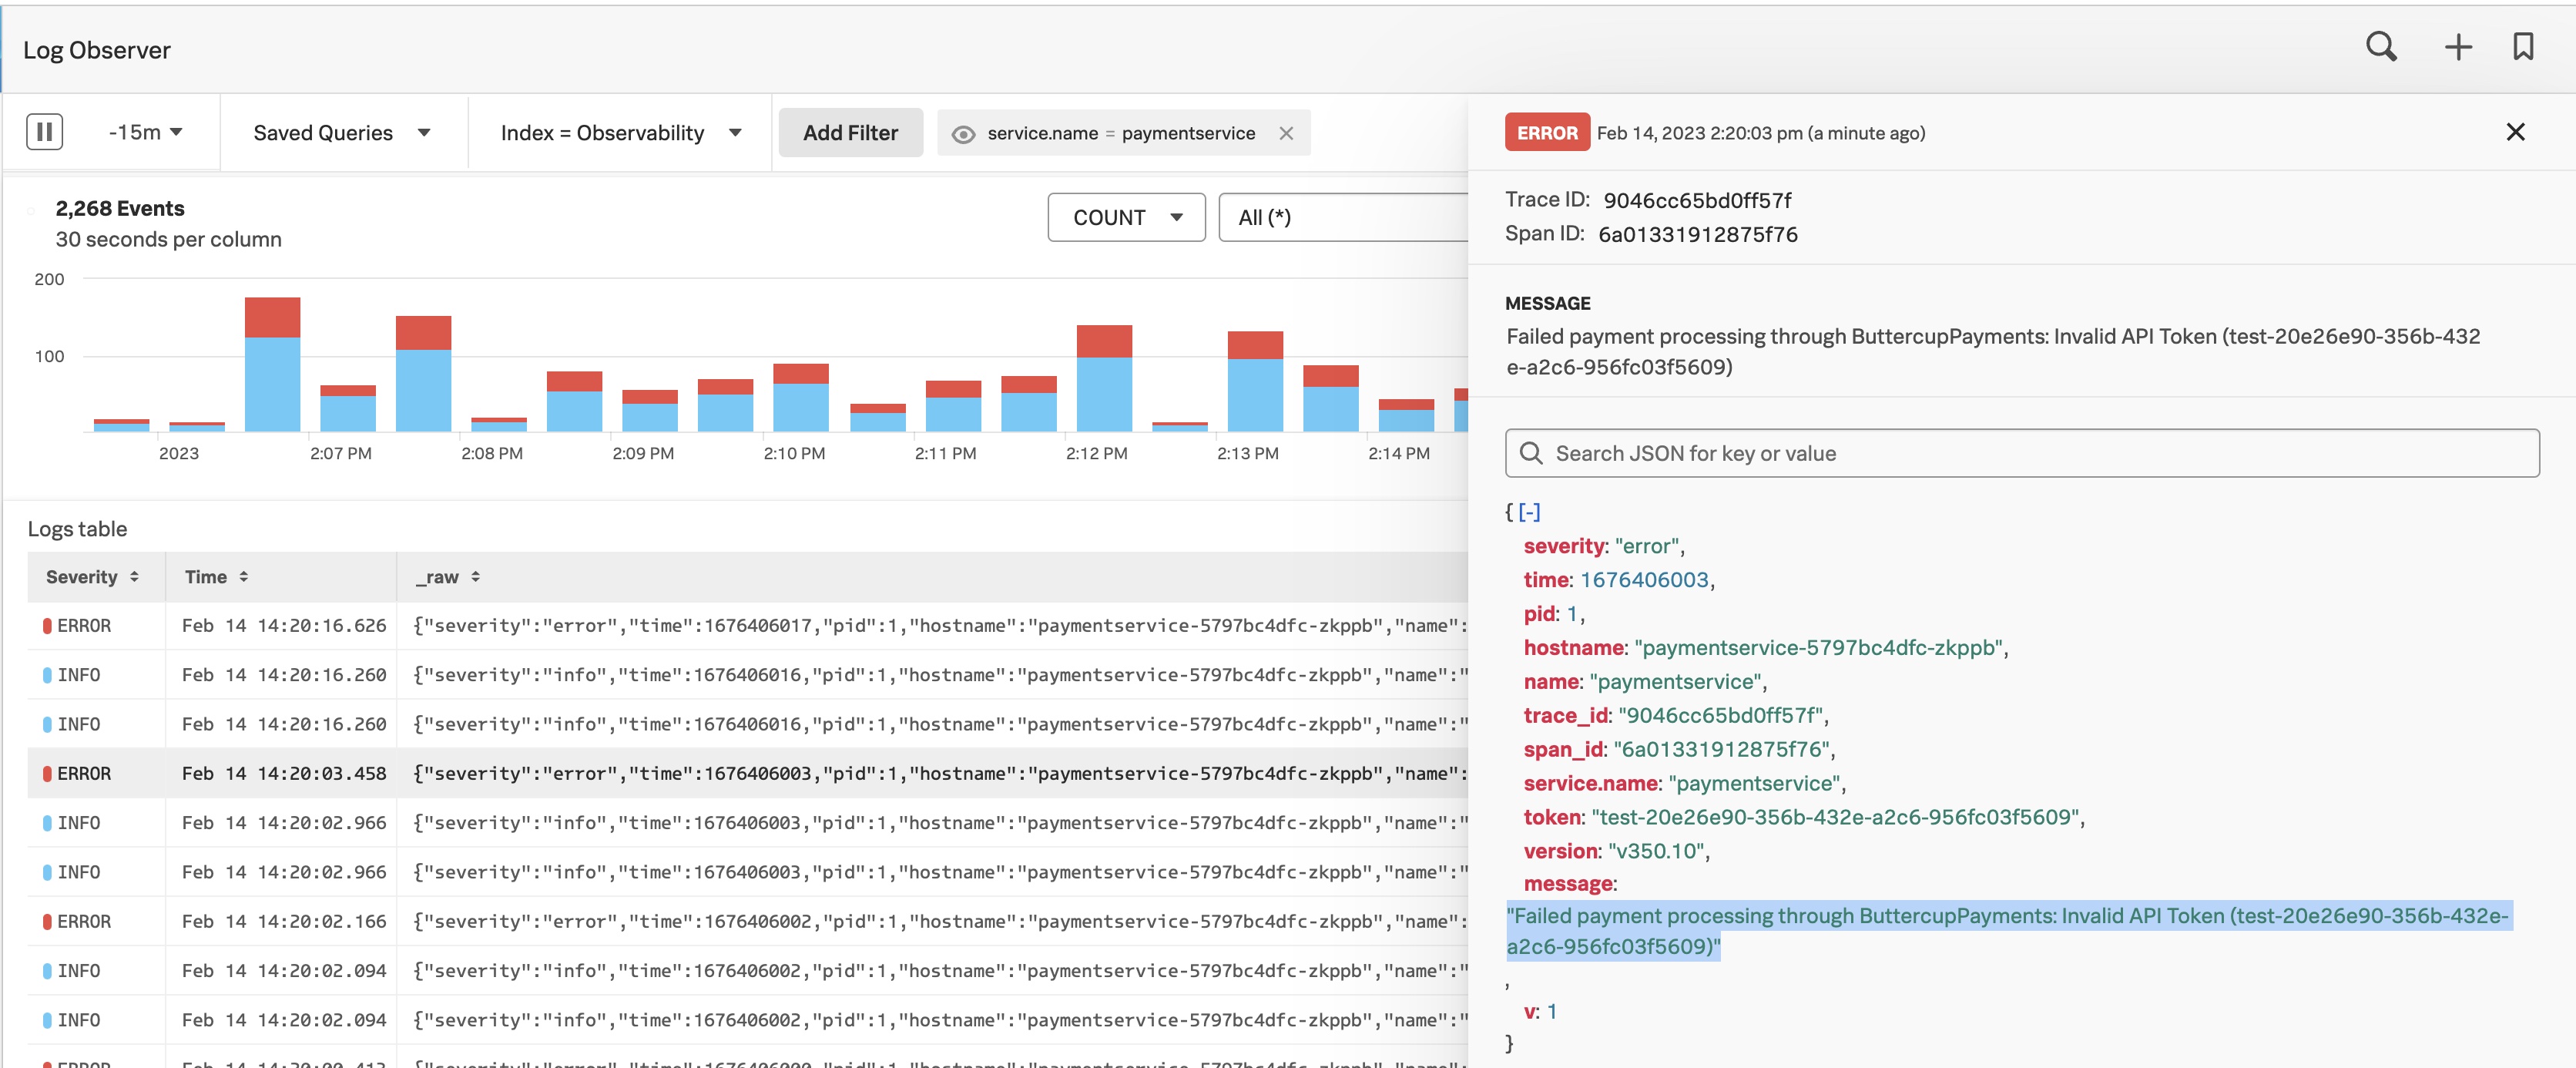
In the Splunk Log Observer UI below, you can easily filter, sort, and aggregate to identify the reason for the service issue. In this example highlighted in blue, there was an invalid API token.
Step 1: Ingest logs
Since logs are located in Splunk Cloud Platform or Splunk Enterprise indexes, you can ingest logs with the Splunk Observability OpenTelemetry Collector or use Splunk Cloud Platform or Splunk Enterprise capabilities for getting log data in.
Step 2: Configure Splunk Log Observer Connect connections
Follow the instructions to install one or more connections from the Splunk Observability Cloud to Splunk Cloud Platform or Splunk Enterprise.
- Set up Log Observer Connect for Splunk Enterprise
- Set up Log Observer Connect for Splunk Cloud Platform
The next page of this Getting Started Guide also provides a comprehensive walk-through of this process for Splunk Cloud Platform.
If you encounter problems, reference Troubleshoot Log Observer Connect setup.
Step 3: Verify successful connection and access to logs
Verify successful connections by going to the Log Observer icon(1) on the left menu. Click the Index filter(2) and select the connection(3) and then select one or more indexes(4) to search. This validates that the logs are accessible.
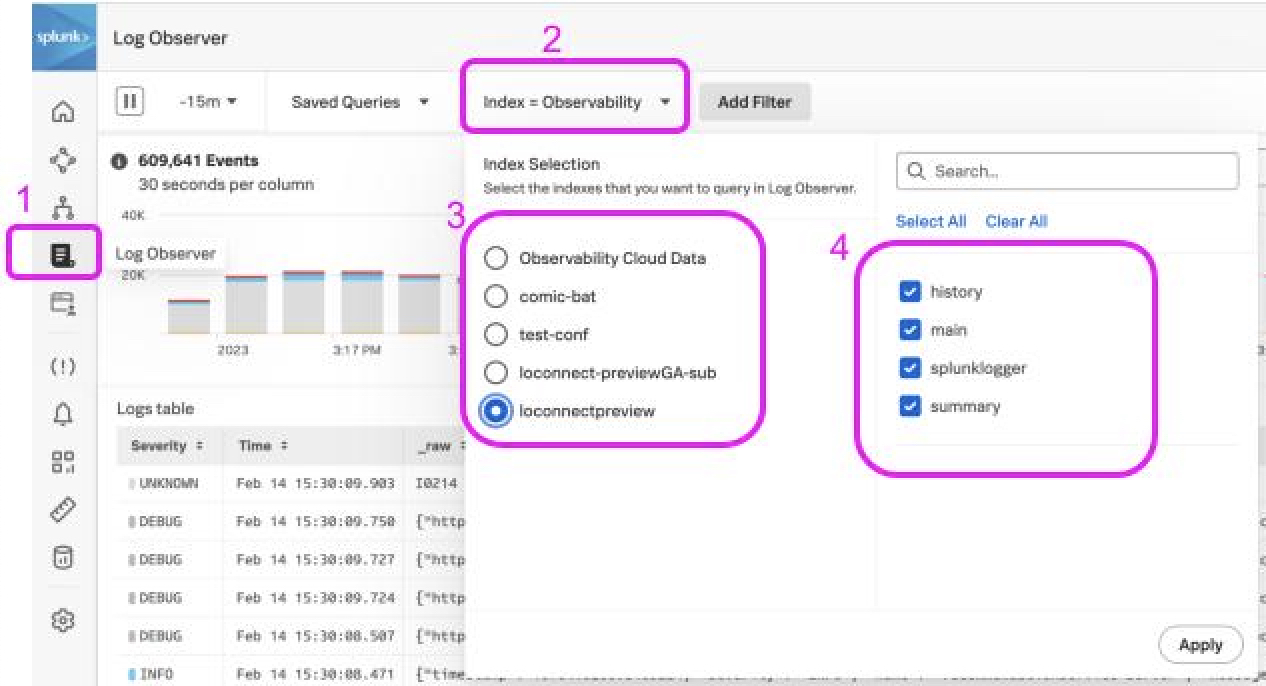
Verify successful connections by going to the Log Observer icon(1) on the left menu. Click the Index filter(2) and select the connection(3) and then select one or more indexes(4) to search. This validates that the logs are accessible.