Monitoring ingress and egress traffic across Operational Technology perimeters
In many organizations, Operational Technology (OT) environments are separated from other environments by a security perimeter (often referred to as an airgap). In many cases, the airgap consists of a firewall, intrusion prevention system (IPS), or data diode.
By closely monitoring ingress (inbound) and egress (outbound) traffic through the perimeter, organizations can gain valuable insights and identify potential threats. In addition, monitoring helps ensure compliance with security policies and allows organizations to be proactive in reducing security risks to OT environments.
This article shows you how you can use the Splunk platform to monitor ingress and egress traffic into OT environments across the security perimeter.
Data required
Traffic data from your perimeter devices is required to monitor ingress/egress traffic. This might be any of the following types of data:
- Network firewall data
- Network traffic data
- Intrusion detection and prevention data
- Operational technology data
- IoT and industrial IoT data
This use case might be easier to implement by using fields from the Common Information Model (CIM). Splunk add-ons can often provide data which is already CIM-compliant.
How to use Splunk software for this use case
To start to monitor your ingress/egress traffic, you'll need to create some macros that contain key information which your searches can reference.
Stage 1: Identify perimeter devices
In this stage, you'll need a way to filter down your traffic logs to only focus on devices that are on perimeter of the OT environment. This is done by creating a Splunk macro called is_perimeter_device which takes in the device sending data and then returns a true or false to confirm whether the device is a perimeter device.
To do this, you can:
- Use a lookup table that has a list of perimeter hosts.
- Use a static list of perimeter devices names (either host names or IPs).
Stage 2: Identify OT devices
In this stage, you'll need to further refine your source or destination hosts to only analyze traffic going to and/or from host(s) located within the OT environment. This is done by creating a macro called is_ot_device which takes in a host then returns true or false to confirm whether the device is within the OT environment.
To do this, you can:
- Use a lookup table that has a list of OT hosts.
- Use a lookup table that has a list of IP ranges for OT devices (for example, when VLANs are used).
- Use a static list of OT devices or characteristics (such as host name pattern).
Stage 3: Egress traffic monitoring
In this stage, you'll monitor egress traffic, or data leaving the OT environment. These types of traffic might be communicating to your corporate network, or external to your organization.
Run the following search. You can optimize it by specifying an index and adjusting the time range.
tag=network tag=communicate
| search `is_perimeter_device(dvc)` = true AND `is_ot_device(src)`=true
| eval label=if(`is_ot_device(src)`=true AND `is_ot_device(dest)`=true, "Internal", "External to OT")
Search explanation
The table provides an explanation of what each part of this search achieves. You can adjust this query based on the specifics of your environment.
|
Splunk Search |
Explanation |
|---|---|
|
|
Search data tagged as network traffic. Alternatively, if you are not using tagged data replace this field with the appropriate source type (for example, |
|
|
This macro identifies where the network traffic is flowing through a perimeter device for OT. |
|
|
This macro identifies whether the source of the traffic resides within the OT environment. |
|
|
Labels the whether the traffic is internal (within the OT environment) or external (within the enterprise network or external to your organization). If both assets are part of the OT environment, then it will be labeled as internal. |
Stage 4: Ingress traffic monitoring
In this stage, you'll focus on monitoring ingress traffic or data incoming into your OT environment, identifying any devices (internal or external to your organization) that communicate with your OT hosts.
Run the following search. You can optimize it by specifying an index and adjusting the time range.
tag=network tag=communicate
| `is_perimeter_device(dvc)` = true AND `is_ot_device(src)`="true"
| eval label=if(`is_ot_device(src)`=true AND `is_ot_device(dest)`=true, "Internal", "OT to External")
Search explanation
The table provides an explanation of what each part of this search achieves. You can adjust this query based on the specifics of your environment.
|
Splunk Search |
Explanation |
|---|---|
|
|
Search data tagged as network traffic. Alternatively, if you are not using tagged data replace this field with the appropriate source type (for example, |
|
|
This macro identifies where the network traffic is flowing through a perimeter device for OT. |
|
|
This macro identifies whether the destination of the traffic resides within the OT environment. |
|
|
Labels the whether the traffic is internal (within the OT environment) or external (within the enterprise network or external to your organization) |
Stage 5: Identify external company systems
While the search in stage 4 provides a method to identify all ingress and egress traffic to OT environments, in some cases it might be more critical to identify traffic to external networks such as the internet. This is done by creating an additional macro called is_external which returns whether a host is external to your organization.
To do this, you can:
- Use a list of IP addresses or IP ranges that are used internally within your organization.
- Flag only assets that are using public IP ranges.
Stage 6: Identify external traffic to your organization
This stage allows you to identify your internal OT to OT traffic, OT traffic to/from your organization’s internal networks, and traffic to external public assets.
Run the following search. You can optimize it by specifying an index and adjusting the time range.
tag=network tag=communicate
| `is_perimeter_device(dvc)` = true AND `is_ot_device(src)`=”true” OR `is_ot_device(dest)=true
| eval label=CASE(`is_ot_device(src)` and `is_ot_device(dest), “OT to OT”, `is_ot_device(src)` AND `is_external(dest)`, “OT to External”, `is_ot_device(dest)` AND `is_external(src)`, “External to OT”, `is_ot_device(src)`, “OT to Internal”, `is_ot_device(dest)`, “Internal to OT”)
Search explanation
The table provides an explanation of what each part of this search achieves. You can adjust this query based on the specifics of your environment.
|
Splunk Search |
Explanation |
|---|---|
|
|
Search data tagged as network traffic. Alternatively, you can specify a source type, source, and index to search untagged data. |
|
|
This macro identifies where the network traffic is flowing through a perimeter device for OT. |
|
|
This macro identifies whether the destination or source of the traffic resides within the OT environment. |
|
|
Leverage a case statement due to the multiple possible combinations. |
|
|
Label OT to OT device communication where the source and destination are both OT hosts. |
|
|
Label egress traffic from OT to external networks where the source is an OT environment but the destination is external network. |
|
|
Label ingress traffic from external networks to OT where the destination is an OT host but originating from an external network. |
|
|
Label egress traffic from OT to internal networks where the source is an OT device communicating to an internal network. |
|
|
Label ingress traffic from internal networks to OT where the source is an internal network to an OT host. |
Next steps
After implementing these searches, you might be interested in exploring more ways to monitor your ingress/egress traffic more proactively. Creating a dashboard or reports like the one below can be useful to be more proactive about suspicious traffic:
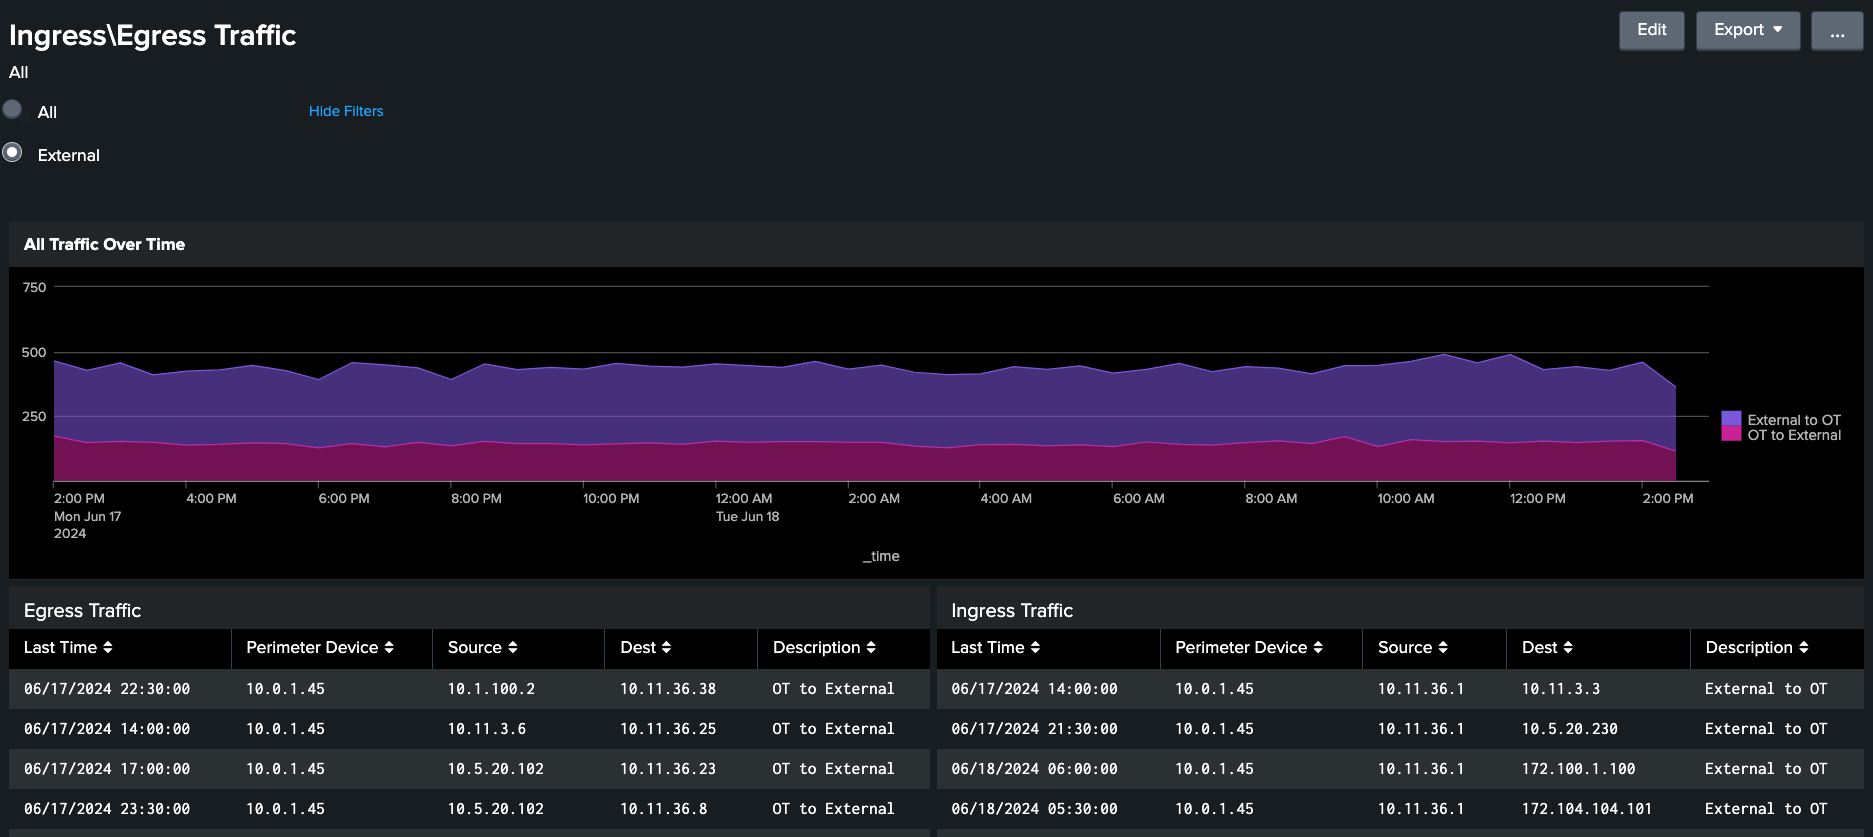
Monitoring suspicious network traffic can help ensure OT systems are adequately protected, but it might also be helpful to identify newly-detected traffic. You can use a lookup table that keeps track of the last time traffic was seen to show only new traffic detected.
Certain types of traffic might represent a higher risk to your OT environment, and you could set up alerts that send emails or create tickets for immediate investigation. For instance, data being transferred out via FTP could be flagged as an immediate concern. Geo-ip lookups and external DNS lookup could also further enhance data being shown in the Splunk platform. The dashboard below shows an example of prohibited traffic in the OT Security Add-on for Splunk.

You could also use the Splunk Machine Learning Toolkit to identify deviations from normal when analyzing suspicious traffic, as most OT networks are more static in nature compared to traditional enterprise networks. Examples of traffic types you might like to monitor include identifying new traffic, anomalous usage patterns, and abnormal network activity outside of normal working hours.
Other resources you might be interested in include:
- The OT Security Add-on for Splunk contains additional dashboards for perimeter monitoring, including identifying prohibited traffic and additional visualizations that show the origin of the prohibited traffic as well the specific perimeter device permitting the traffic. These visualizations help identify suspicious traffic, aid in investigation of prohibited traffic, and aid in proactively identifying traffic which might pose a risk to OT environments.
- The CISO’s guide to complete security for industrial control systems might be useful to identify key areas of focus for protecting OT and industrial control system environments.